
At the “Environmental Security of the State” conference, held on April 16, 2026 at the Kyiv Aviation Institute, Vladyslav Balinskyi, head of the Green Leaf NGO and the Odesa branch of the National Ecological Centre of Ukraine, presented research results showing that satellite monitoring of the Black Sea is becoming a key tool for documenting oil pollution and building an evidence base for environmental violations.
From observation to evidence
Two main types of satellite data are used for monitoring. Sentinel-1 provides radar data that work in any weather conditions and can detect changes in the state of the water surface. Sentinel-2 provides high-resolution optical data. Crucially, neither tool is sufficient on its own — they need to be integrated.

Satellite data alone are not enough for detailed and accurate monitoring, so NECU staff Vladyslav Balinskyi, Ruslan Havryliuk and Vitalii Hulevets, within the SUNDANSE project, developed an integrated method for tracing heavy-fuel-oil plumes. It combines analysis of Sentinel-1 and Sentinel-2 satellite data, backward modelling, meteorological correction and visualization analysis. This approach makes it possible not only to detect pollution but also to identify its source and spatial dynamics.
This is not merely a technical tool but a comprehensive system for reconstructing the source and dynamics of pollution under conditions of limited access.
The multisensor approach combines different types of satellite data with physical modelling of processes in the marine environment. Its key idea is not merely to detect a slick but to interpret it as an indicator of processes occurring in the water.
Sentinel-1 can detect changes in sea-surface micro-roughness and identify so-called dark-core zones — areas where wave action is dampened and which may indicate the presence of surface-film pollution. Sentinel-2 provides visual verification and a more detailed view of plume structure using spectral indices and specialized visualizations.
These data are combined with:
— backward modelling (backtracking) of pollution movement, taking currents and wind into account;
— meteorological correction that accounts for the influence of wind, cloud cover and thermal stratification;
— visualization analysis using spectral indices such as NDWI, False Color and others.
A separate element is the method of differential tracing of dark-core zones. It makes it possible to analyze how characteristic “dark cores” shift relative to the spill source under the influence of hydrodynamic processes and to localize underwater pollution sources even without direct access to them.
In practical terms, this provides three critically important capabilities:
— locating the source of a spill, including underwater shipwreck fragments;
— tracking the spatial dynamics of a plume in both the short term and seasonally;
— verifying pollution while reducing the risk of false interpretation.
The method also takes the limitations of each data type into account. For example, it can compensate for situations in which SAR imagery becomes less informative because of wind or produces false signals as a result of atmospheric-oceanic processes. In such cases, optical verification plays a key role.
This makes the method not only a way to detect pollution, but an evidence-oriented analytical tool that moves satellite observations from merely recording phenomena to establishing their origin, duration and scale.
Using this method, researchers analyzed heavy-fuel-oil leaks following the accident involving Russian tankers in the Kerch Strait on December 15, 2024, and also identified the coordinates of shipwreck fragments and the way the heavy fuel oil spread.
In June 2025, a presentation on the new method ranked among the top three papers at the 25th International Scientific and Practical Conference “Ecology. Human. Society” at Igor Sikorsky Kyiv Polytechnic Institute.
From accident to systemic pollution
After the Volgoneft tanker accident on December 15, 2024, satellite data showed not a one-off heavy-fuel-oil spill in the Kerch Strait but a prolonged process of Black Sea pollution. In particular, a spill recorded near Novorossiysk on August 29, 2025 later stretched for more than 20 km.
Satellite data show the following dynamics:
- initial formation of a smaller slick;
- subsequent stretching under the influence of hydrometeorological factors;
- lack of effective containment.
Sentinel-1 and Sentinel-2 images from August 29 and September 2, 2025 also show:
- a large slick covering more than 100 km²;
- separate pollution hotspots closer to shore that may be associated with heavy fuel oil rising from bottom sediments;
- characteristic plumes indicating continued leakage from shipwreck fragments.

Photo 1 (Sentinel-2, 29.08.2025) — initial slick 2.9 km long (44.6218° N, 37.6585° E). Attemptsare visible to deploy booms — without success.

Photo 2 (Sentinel-1 SAR, 29.08.2025) — later the same day, the slick had already stretched more than 20 km westward

Photo 3 (Sentinel-1 SAR, 02.09.2025) — two types of pollution:
— a large slick (~178 km²), the result of the 29.08 accident
— smaller slicks closer to shore, caused by heavy fuel oil rising from bottom deposits that had not been removed after the 15.12.2024 disaster (highlighted in yellow).
Characteristic “tails” of heavy fuel oil from wreck fragments opposite the Kerch Strait are also clearly visible (highlighted in red). This is direct evidence that the Volgoneft tanker wrecks had not been sealed and that leakage was still continuing at that time.
On September 2, 2025, new slicks were detected from Novorossiysk toward Anapa, along with secondary pollution near the Bugaz Spit.
At the end of winter 2025–26 reports of new heavy-fuel-oil deposits came from different parts of the Black Sea coast. February storms lifted near-bottom water layers in the accident area, causing petroleum products to be released again.
This indicates that the pollution source had not been eliminated and that heavy fuel oil continues to rise periodically from bottom sediments. It also confirms the systemic nature of the pollution and the inadequacy of response measures.
Field studies, including work within Tuzly Estuaries National Nature Park, confirmed these findings: heavy-fuel-oil clumps were found up to 650 km from the accident site, demonstrating transboundary spread of pollution. The problem is also relevant to Odesa Bay, which is under substantial anthropogenic pressure.
New 2026 data: pollution continues
Satellite monitoring in 2026 confirms that the process is ongoing:
- March 10, 2026 new pollution was recorded in the waters off Novorossiysk. At the same time, Sentinel-1 radar data were uninformative because of strong wind, while Sentinel-2 clearly captured surface-film pollution.
- April 6, 2026 in the Tsemess Bay area near Novorossiysk, optical data revealed a long oil plume, while SAR images, affected by thermal stratification, did not show the real picture or could have generated false signals.
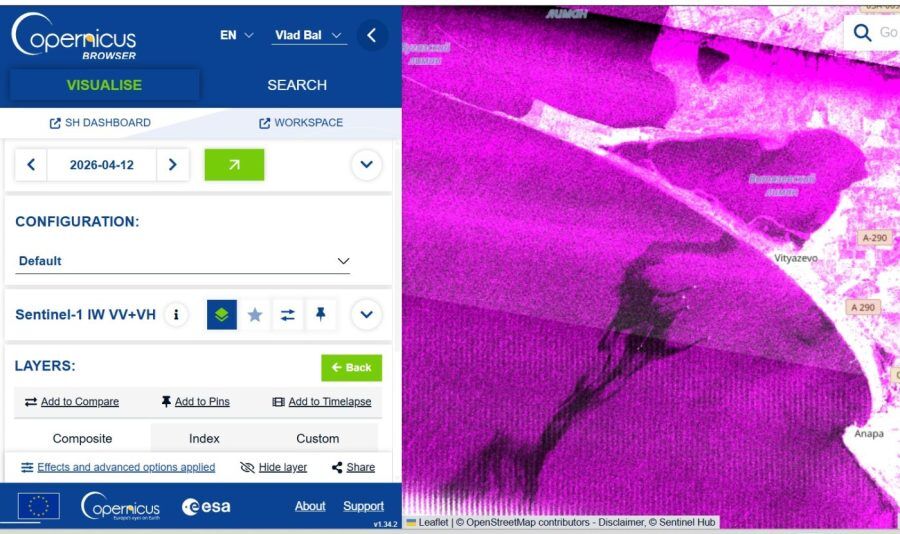
- April 12, 2026 heavy-fuel-oil pollution was recorded near Anapa and the Bugaz Spit and appeared simultaneously in both SAR and optical imagery. NDWI and False Color made it possible to clearly distinguish the plume structure.

Photo 4. Oil plume in the Tsemess Bay area (Novorossiysk), 06.04.2026. Sentinel-2 image

Photo 5. Heavy-fuel-oil pollution near Anapa and the Bugaz Spit on 12.04.2026. Sentinel-1 (SAR, IW VV+VH) clearly recorded the oil plume and the absence of any pollution-response work, such as containment booms

Photo 6. Confirmation of heavy-fuel-oil pollution on 12.04.2026 using Sentinel-2: NDWI — highlighting the plume structure; False Color (Urban) — enhancing the contrast of the oil pollution
Taken together, these cases demonstrate the continuous and dynamic nature of the pollution and confirm the need for a comprehensive approach to its analysis.
Secondary pollution as a key factor
Satellite data also record secondary pollution hotspots — diffuse heavy-fuel-oil slicks created when bottom sediments are resuspended during storms.
This means that the pollution has a multi-level structure and can re-emerge even without new accidents.
“Oil slicks keep appearing on the water in Anapa Bay, and residents are looking for the sources of pollution. Naturally, the first thing they see is a ‘Ukrainian trace’ — strikes on oil-transfer facilities in Russian ports. But no ‘Yarosh business card’ is needed here. Russians did it themselves when they allowed their ‘shadow fleet’, which transports petroleum products, to enter the Black Sea and thereby finance the genocidal war against Ukraine,” Vladyslav Balinskyi says. “There are already substantial accumulations of heavy fuel oil on the bottom of the bay — effectively secondary pollution hotspots, or deposits, in the seabed sediments. They can be released again under the influence of storms and changes in water temperature. Biological processes also occur in bottom sediments, including decomposition of organic matter that releases hydrogen sulfide. It ‘picks up’ the heavy fuel oil and carries it to the surface. This causes continuous recirculation of petroleum products and creates chronic pollution in Anapa Bay. The process may continue for years. This is why improving remote monitoring of the sea is so important — so that we can forecast the spread of pollution, including toward the coastline controlled by Ukraine.”
What is new: SAR limitations and the role of optical data
Recent research has significantly refined our understanding of the capabilities and limitations of radar data. Balinskyi discussed this during a roundtable at the “Environmental Security of the State” conference. He identified three critical situations:
- Strong wind: SAR images become noisy and may not allow pollution to be detected;
- Atmospheric-oceanic processes: false-positive signals can arise and imitate oil slicks;
- Thermal stratification: real oil plumes can be partly or completely masked.
The most important new conclusion is that SAR can not only “miss” pollution but also distort the real picture.
At the same time, Sentinel-2 optical data, including NDWI, False Color and other processing scenarios, can:
- verify pollution;
- clearly reproduce the structure of heavy-fuel-oil plumes.

Photo 7. SAR limitations: false indicators under complex atmospheric conditions
Oil pollution in the Tsemess Bay area (Novorossiysk) 06.04.2026. Top-left image: Sentinel-1 (SAR) under thermal stratification of the near-surface layer does not show the real plume and may mask it or lead to false-positive interpretation. Top-right and lower images: Sentinel-2 clearly visualizes the extended oil plume. Optical scripts (False Color Urban, NDWI, True Color) provide verification of the pollution
Thus, under favourable conditions, SAR and optical data produce consistent results and increase the reliability of interpretation.
Evidence base and legal implications
Satellite data have made it possible to demonstrate:
- the systemic nature of leaks;
- their recurrence;
- the formation of long heavy-fuel-oil plumes;
- the transboundary spread of pollution.
These results confirm the systemic nature of marine pollution and may indicate violations of numerous international conventions and agreements. In particular:
- MARPOL 73/78: breaches of pollution-prevention requirements
- OPRC 1990: failure to provide an adequate spill response
- CLC 1992 / IOPC Funds: grounds for compensation for heavy-fuel-oil damage
- UNCLOS (Articles 192, 194): failure to comply with obligations to protect the marine environment
Satellite data create an independent evidence base for environmental violations:
- Criminal law: potential qualification as ecocide under Article 441 of the Criminal Code of Ukraine
- Civil law: grounds for compensation under CLC / IOPC
- International law: evidence of violations of MARPOL, OPRC and UNCLOS
- Sanctions policy: identification of “shadow fleet” activities
Today, satellite monitoring is moving beyond being merely a scientific tool and is becoming a key component of the evidence base for environmental violations. Events in the Novorossiysk and Anapa areas in 2025–2026 show that the pollution not only continues but also bears signs of an uncontrolled process, requiring international legal assessment. Integrating different types of data makes it possible to document environmental damage even in areas with restricted access and to build a basis for accountability.