

Mass Dolphin Deaths in the Black Sea: Scientists Link the Tragedy to Russia’s War
Mass dolphin deaths in the Black Sea reached an unprecedented scale in spring 2026. In just a few days, dozens of dead cetaceans were found along the coast of Tuzly Estuaries National Nature Park. Scientists link the tragedy to the combined impact of Russia’s war against Ukraine — acoustic pollution, chemical contamination of the marine environment, and ecosystem destruction.
Read More

900 km² in the Black Sea: chronology and consequences of the oil spill after the russian attack on April 26, 2026
Updated on May 4, 2026
Vladyslav Balinskyi, Researcher at the Tuzly Estuaries National Nature Park, Head of the Odesa branch of the National Ecological Center of Ukraine (NECU)
During the night of April 25–26, 2026, between 02:09 and 03:42, Russian Shahed-136/«Geran-2» drones attacked the port infrastructure of the city of Chornomorsk. The strike damaged three sunflower oil tanks (3,000 tonnes each) at the RISSOIL-Terminal LLC, Chornomorsk Sea Port, 28 Transportna Street. According to the worst-case scenario principle (OPRC Convention, 1990), approximately 6,000–6,500 tonnes of edible oil entered the open sea. The Odesa Regional Prosecutor’s Office opened criminal proceeding No. 22026160000000254 under Article 438 of the Criminal Code of Ukraine.
This article is an attempt to document what happened next, based on Sentinel-1 SAR imagery, Sentinel-2 optical data, and field observations.
? What you need to understand before reading
- Sunflower oil is not toxic in the classical chemical sense. Its impact is physical and biogeochemical: the surface slick blocks gas exchange, sticks bird feathers, emulsifies into the water column, and during biodegradation can cause local oxygen depletion (hypoxia). Part of the product undergoes oxidation and partial polymerization, eventually sinking to the seabed and entering trophic chains.
- Surface area of contamination ≠ mass of oil. A decrease in the visible slick does not mean the oil has disappeared – it may move into the water column or partially settle on the bottom.
- April 30 was the peak of surface coverage. The subsequent impact shifts into the water column and bottom sediments.
- International law equates vegetable oils to petroleum products (EPA 40 CFR Part 112, MARPOL Annex II, Bucharest Convention) – not because of toxicity, but because of identical mechanisms of harm to the environment.
? The symmetry that does not exist: Tuapse vs Chornomorsk
On April 26, 2026, satellites recorded two different events in the Black Sea.
- Tuapse, Russian coast: dark oil streaks from the oil refinery – separate winding threads. The surface contamination area during peak days (April 26 – May 3) was about 80 km².
![Sentinel-2 L2A, Highlight Optimized Natural Color, Туапсе, 26 квітня 2026. Туапсинський НПЗ (ООО РН) і нафтові тяжі у відкритому морі. Окремі слики. Масштаб: 1 км. Copernicus Sentinel data 2026.]](https://zeleniy-list.od.ua/wp-content/uploads/2026/05/tuapse-voda.jpg)
- Chornomorsk, Ukraine: a continuous sunflower oil slick that at its peak on April 30 reached 899.5 km² – more than 11 times larger.
Direct comparison of contamination areas of different substances has limitations (different physico-chemical behavior). However, the orders of magnitude allow us to assess the spatial scale: in the Ukrainian case it is an order of magnitude larger.
? Chronology: April 26 – May 4 (SAR facts)
Methodology: Sentinel-2; Sentinel-1, C-band, VV+VH polarization, linear gamma0. Oil dampens backscatter – it appears as a dark anomaly on the images.
| Date | Instrument | Parameter | Note |
|---|---|---|---|
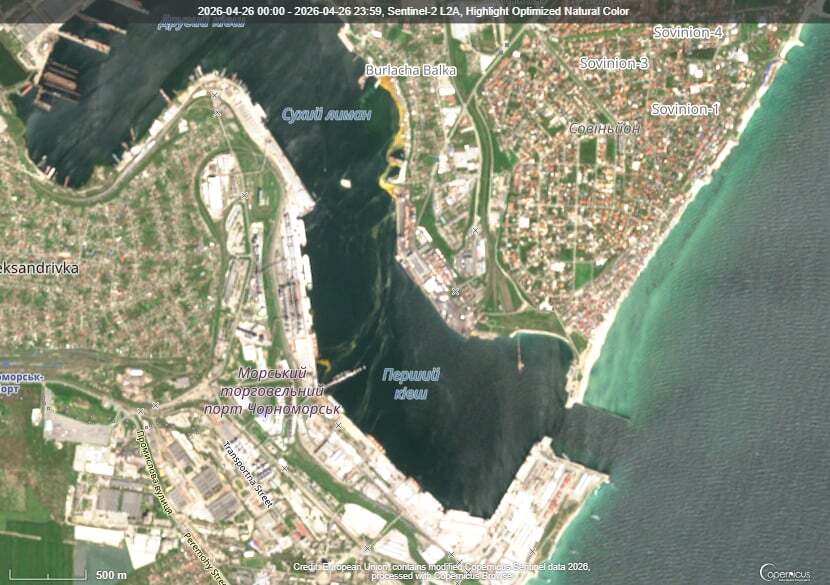
| 26.04 | Sentinel-2 L2A | port area, Sukhyi Estuary | day of the attack, ~6,000–6,500 t to sea – Fig.2 |
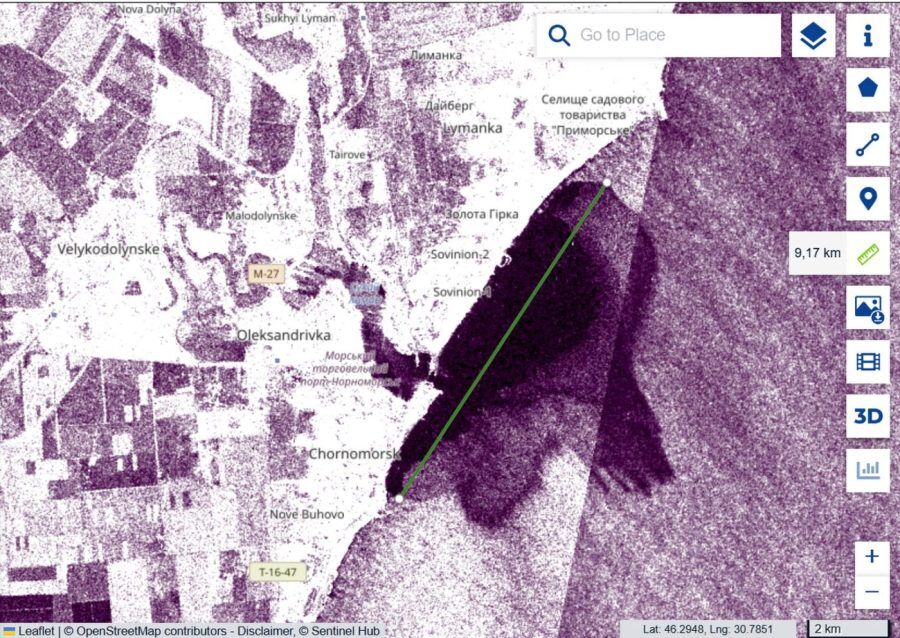
| 27.04 | Sentinel-1 SAR | anomaly 9.17 km | along the coast – Fig. 3a |
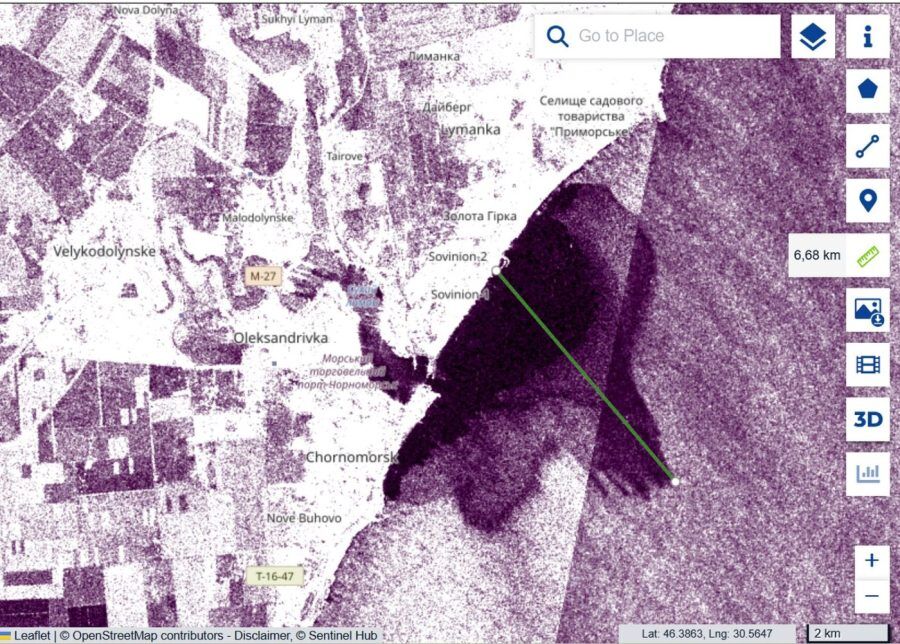
| 27.04 | Sentinel-1 SAR | anomaly 6.68 km | exit to sea – Fig. 3b |
| 28.04 | Sentinel-1 SAR | anomaly 35.73 km; ~250–300 km² | past Odesa – Fig. 4 |
| 28.04 | Confirmation photo | confirmation of oil transition into water column | Odesa, 411th station – Fig. 5 |
| 29.04 | Sentinel-1 SAR | 694.23 km² | vortex forms – Fig. 6 |
| 30.04 | Sentinel-1 SAR | 899.50 km² | peak surface area – Fig. 7 |
| 03.05 | Sentinel-1 SAR | 450.29 + 227.8 = 678 km² | split into two components – Fig. 9a, 9b |
| 04.05 | Sentinel-1 SAR | n/a (area not determined) | split into three components – Fig. 10 |
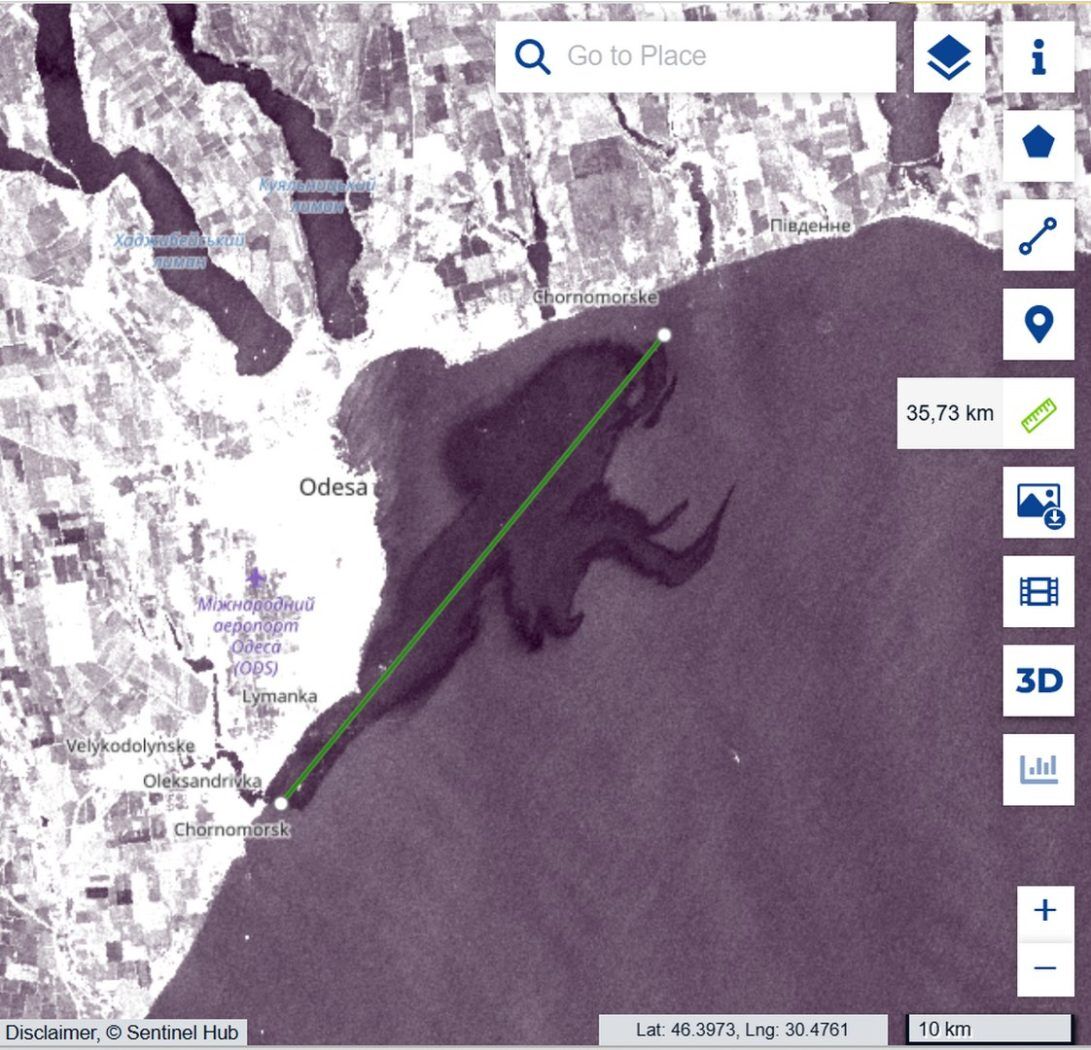
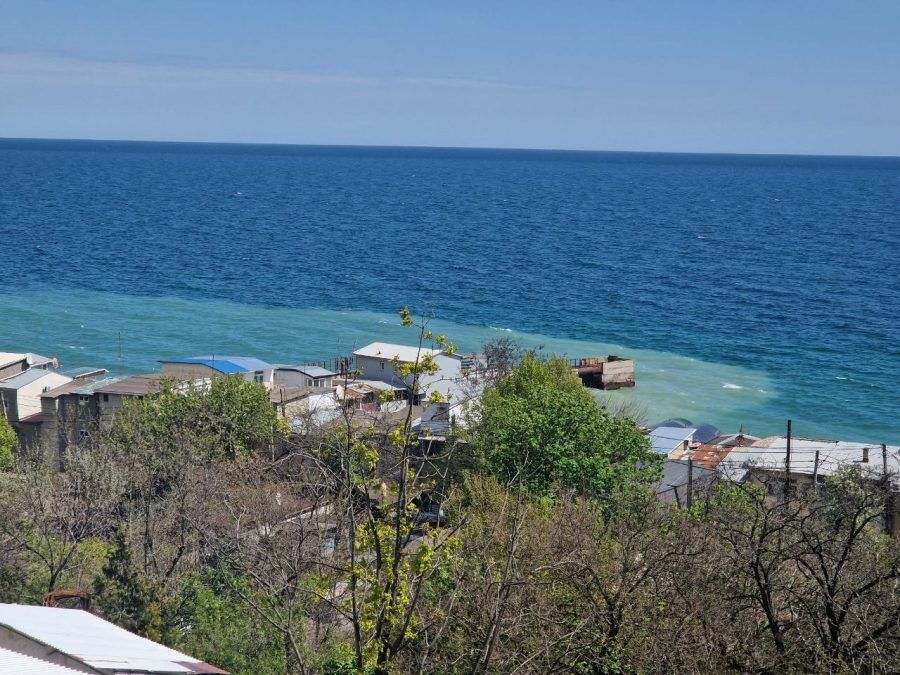
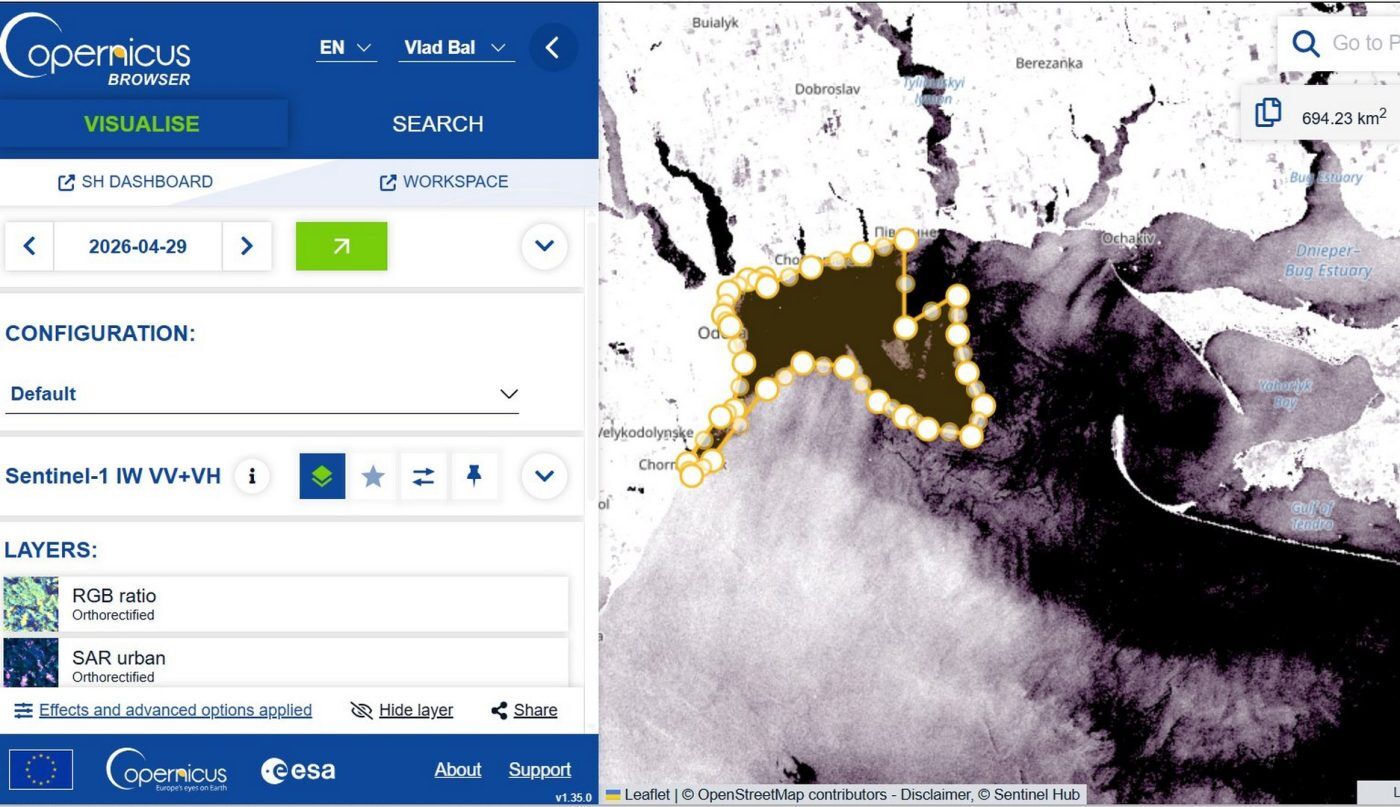
?️ Meteorological conditions on April 30, 2026 – key moment of drift
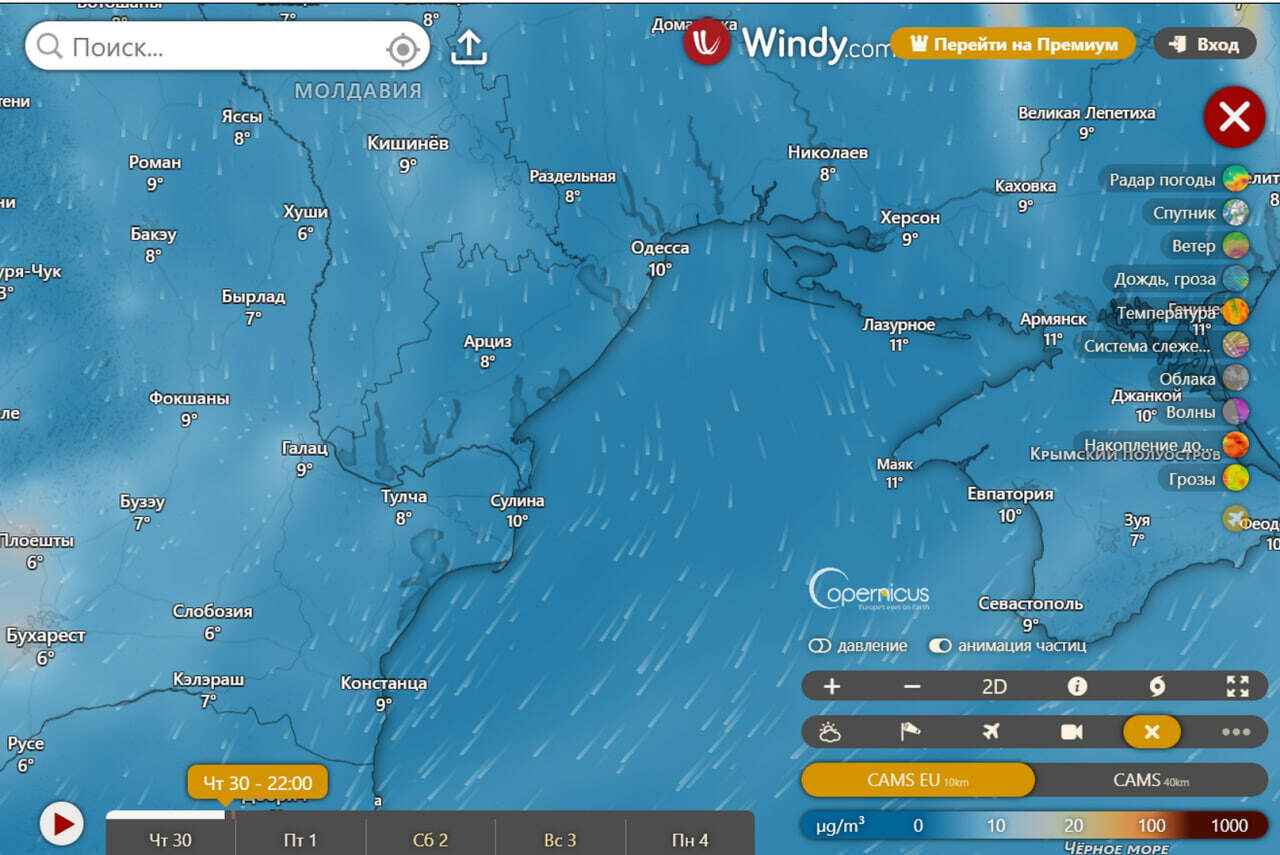
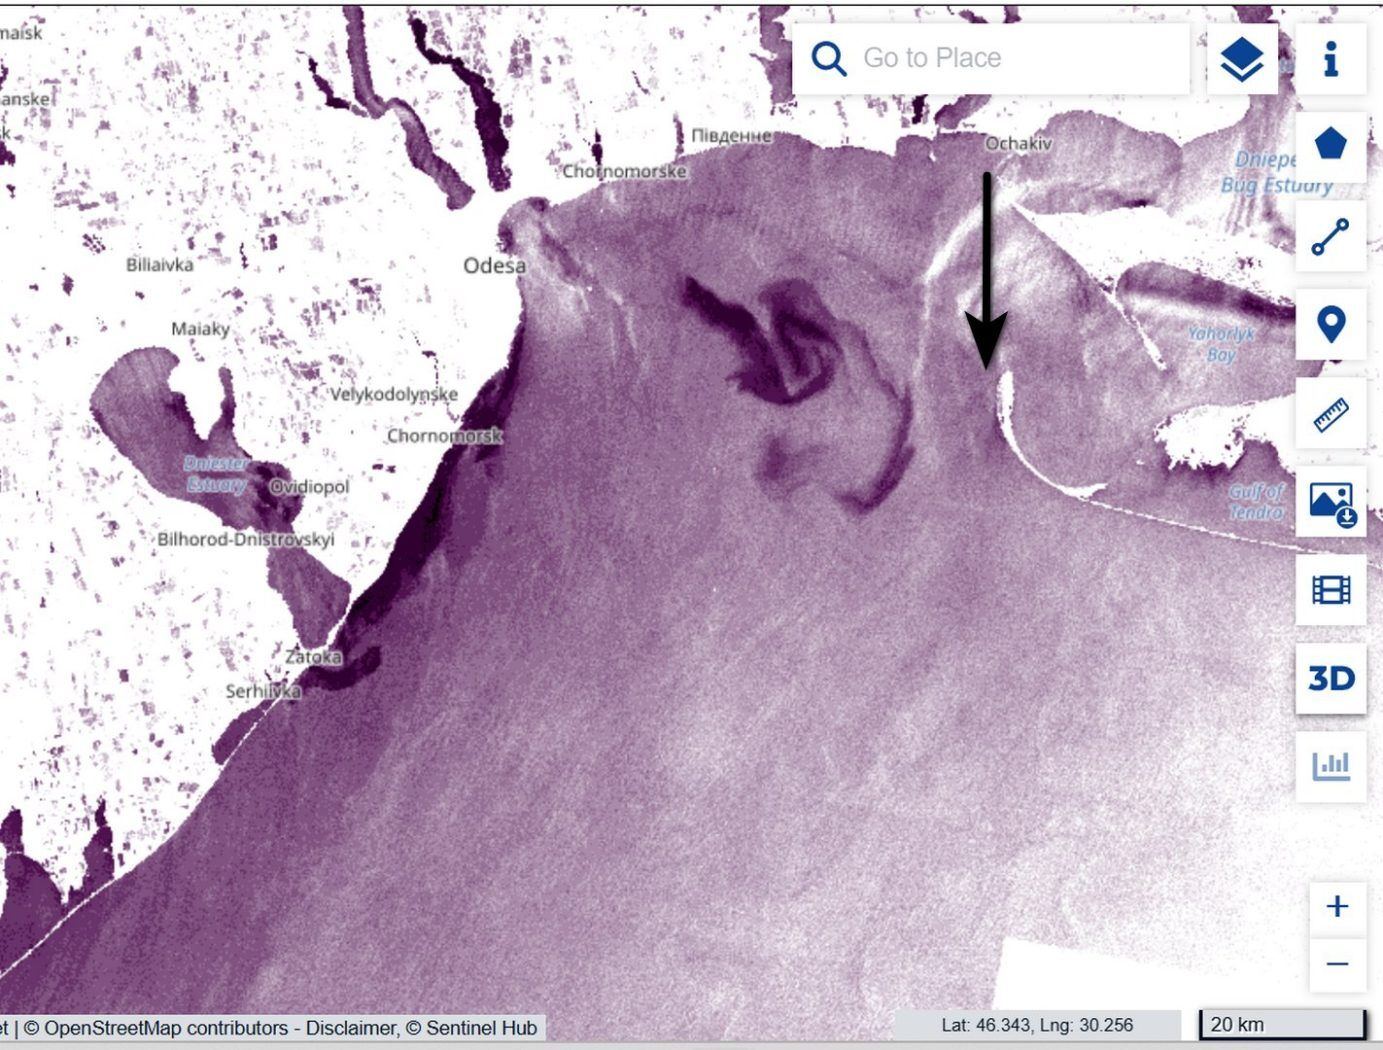
This image explains why the slick, which was carried out to the open sea by offshore winds on April 26–28, began to return to the coast on April 30 and turn toward the Tuzly Estuaries NPP.
? May 3: two components – threat to Tendra Spit
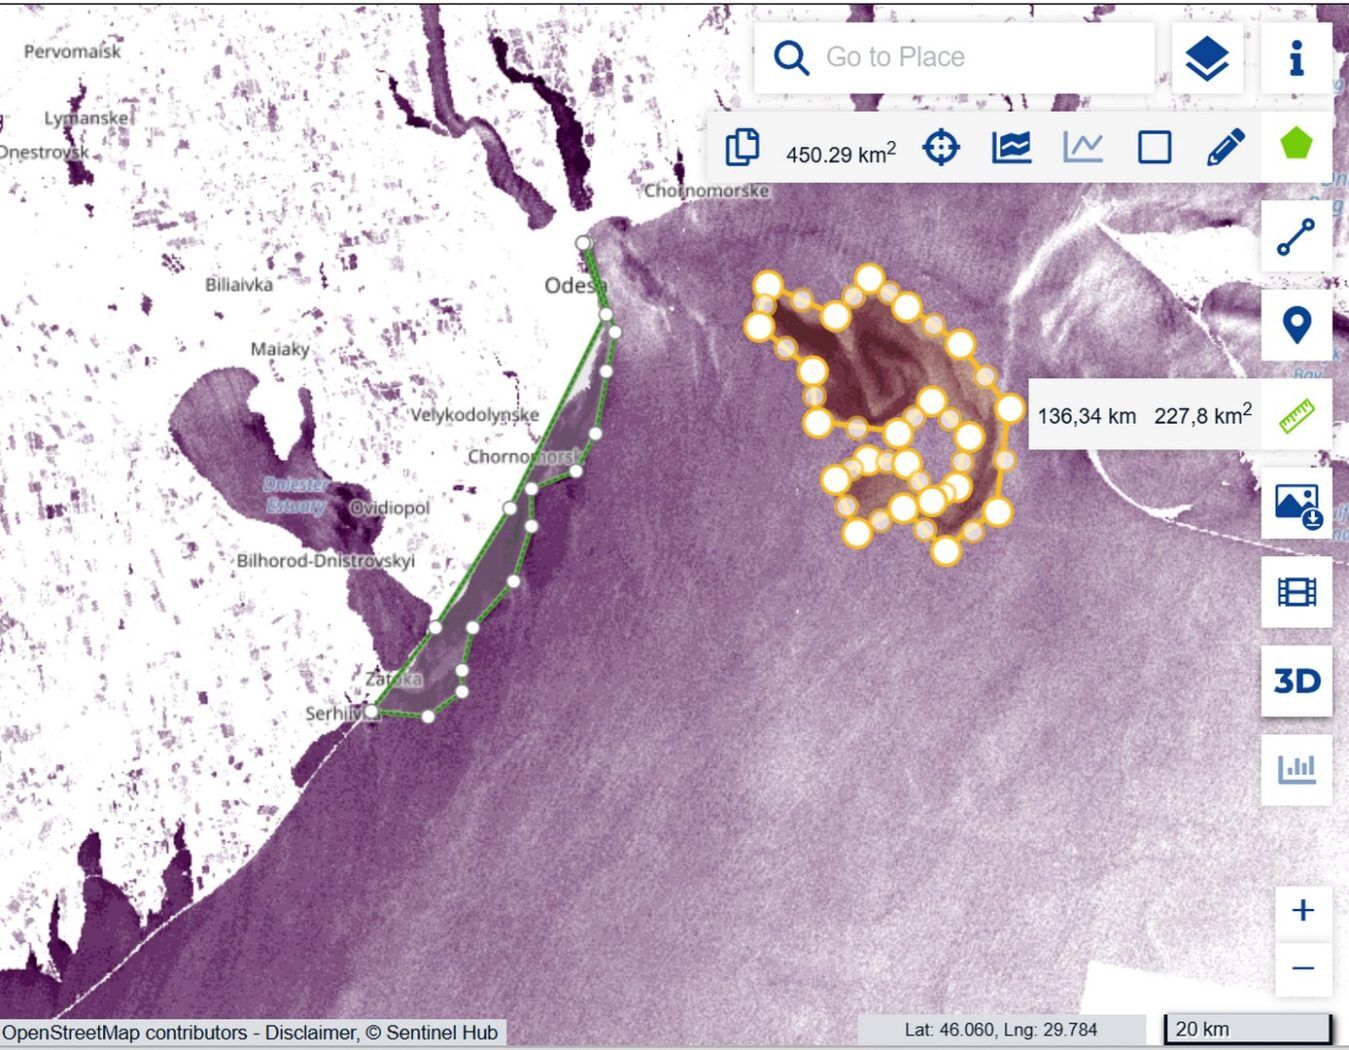
On the SAR image of May 3, the slick split for the first time into two structurally different components with different drift trajectories.
Cyclonic component in the open sea – 450.29 km² (yellow polygon). Captured by vortex circulation, moving toward Tendra Spit and Yahorlyk Bay. This is the peak of the nesting season there.
Coastal strip – 227.8 km², perimeter 136.34 km (green polygon). Stretched along the coast from Odesa to Serhiivka.
⚙️ Why did the visible area decrease between April 30 and May 3?
The observed decrease in total surface slick area (from 899.5 to ~678 km²) does not mean the oil disappeared. It reflects redistribution of contamination between the surface, water column, and bottom sediments due to three simultaneous processes:
- Emulsification – waves break oil into droplets that distribute in the surface layer (depths of several meters). Such dispersion gives much lower radar contrast or becomes invisible.
- Oxidation – UV light and oxygen alter the chemical structure of unsaturated fatty acids; the surface slick becomes more viscous and its radar contrast decreases.
- Beginning of sedimentation – partially oxidized and polymerized fractions together with adsorbed organic matter (phytoplankton, detritus) form aggregates that slowly sink to the bottom. This process takes weeks, but starts now.
Conclusion: the oil has not disappeared – it has changed its form of presence. The impact shifts from surface-concentrated to volume-distributed, making monitoring more difficult and expanding the range of vulnerable species.
? May 4: cyclonic component disappeared under water – coastal strip split again
Images from May 4 record a fundamental change in contamination dynamics.
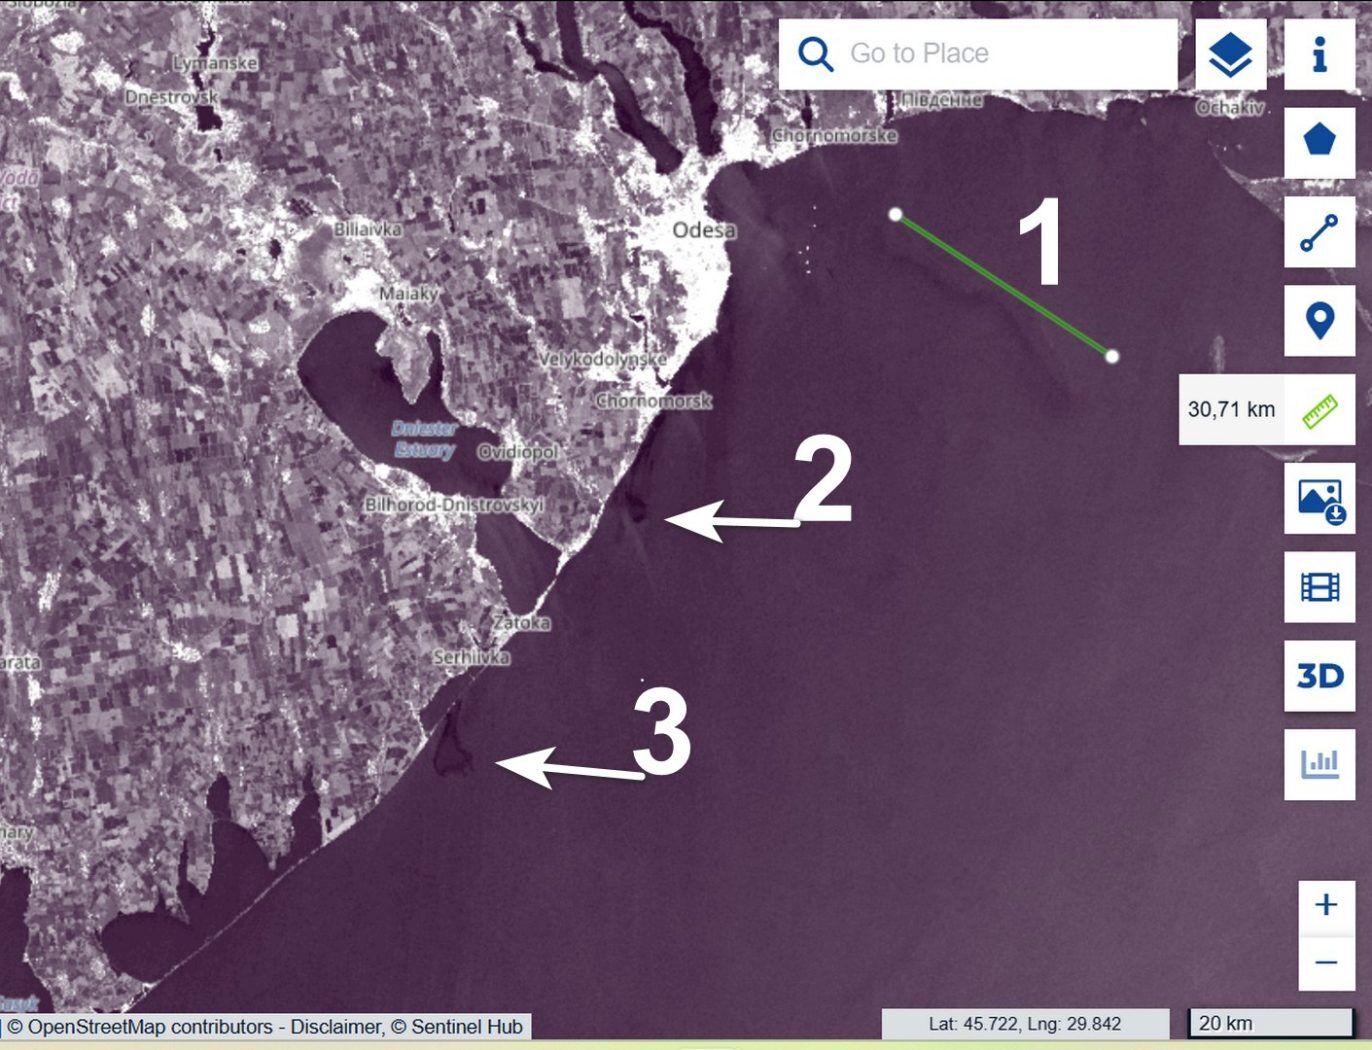
The cyclonic component (450.29 km²) disappeared from the surface. Most likely, this is due to a change in the physical state of the contamination: emulsification, fragmentation of the surface slick, and reduction of radar contrast. Part of the oil may have moved into the water column or into a finely dispersed state not detected by SAR as a continuous anomaly. Such redistribution may increase risks to benthic ecosystems.
The coastal strip split into two: the first part stretched from Velykyi Fontan cape to Hrybivka; the second passed Serhiivka and lies opposite Kurortne village. The distance from the second part to the border of the Tuzly Estuaries NPP is about 30 km. In the coming days, suspended threads and emulsified oil clumps in the water column may begin to reach the park.
? Precedent of December 2025: what we already know
On December 20, 2025, after a strike on the Pivdennyi port, a sunflower oil spill occurred with an area of up to 730 km². Documented consequences:
- Death of about 5,000 birds (grebes, cormorants, swans). Oil sticks feathers, destroys thermal insulation – birds drown or freeze. Important: according to our observations, the share of return to nature after washing is extremely low (a few percent) – vegetable oil paradoxically damages feather structure more deeply than fuel oil.
- Contamination of the Tuzly Estuaries NPP perecyp (bar) after the storm on February 6, 2026, on an area of about 10,000 m². Thousands of crabs of four species died.
- Mass stranding of seahorses (Hippocampus guttulatus) on January 27, 2026 – up to 35 individuals per m². The mechanism (polymerization, sedimentation, clogging of gills by resuspended aggregates) is a working hypothesis that requires separate laboratory verification.
- Time lag – the first wave of contamination reached the NPP perecyp about 7 weeks after the initial event.
Based on this precedent, for the April spill, contamination is likely to reach the Tuzly Estuaries NPP in June 2026 (5–8 weeks).
? Forecast (observation guidelines)
- May 2026 (now) – peak spring bird migration. The coastal strip is already on the shore. First contaminated individuals are likely in the coming days.
- June–August 2026 – oxidation, partial polymerization, settlement of part of the aggregates to the bottom, chronic contamination of mussel beds.
- Autumn–winter 2026/2027 – autumn storms may resuspend settled aggregates. Similar to January 2026, a potential threat of a new wave of seahorse and other demersal species deaths.
? Three spills in two years: a systemic pattern
- October 2024 – Sukhyi Estuary, 125 t of oil, damage UAH 10.9 billion.
- December 2025 – Pivdennyi port, area up to 730 km².
- April 2026 – Chornomorsk port, peak 899.5 km², transition into the water column.
These are not random incidents. They are a documented sequence of strikes on civilian food infrastructure with a foreseeable environmental outcome.
? What to do now
- Record coordinates of slicks, oily deposits on the shore, contaminated birds. GPS, photo, time.
- Photograph optical water turbidity (turquoise / milky-green hues – signs of emulsified oil).
- Do not handle birds without a protocol – better pass coordinates to experienced volunteers.
- Send data to NECU, Tuzly Estuaries NPP, monitoring groups.
- Avoid eating seafood and fish from the contaminated zone in the coming months.
Every image, every coordinate is evidence for the Bucharest Convention, the UNEP mandate, and the international recognition of ecocide.
? Summary
The recorded event demonstrates not only the scale of a single contamination, but also a reproducible pattern of impact: from surface spill to long-term ecosystem contamination through the water column and bottom sediments. The sequence of events in 2024–2026 indicates the systemic nature of such incidents and the predictability of their environmental consequences. In this sense, we are not talking about a single incident, but about the formation of a long-term environmental footprint of war in the Black Sea.
The author thanks the team of the Tuzly Estuaries National Nature Park and personally Dr. Ivan T. Rusiev for joint field observations. Data: Sentinel-1, Sentinel-2, Ukrainian Hydrometeorological Center, Windy.com.
Vladyslav Balinskyi, May 4, 2026
Green Leaf NGO, Tuzly Estuaries NPP, NECU

The monitoring and analytical work presented in this publication was supported by the Deutsche Bundesstiftung Umwelt (DBU, German Federal Environmental Foundation) within its program supporting Ukrainian researchers and environmental practitioners. The findings, interpretations, and conclusions expressed herein are those of the author and do not necessarily represent the official position of DBU.
Spatial‑dynamic model of an oil fire: from emission to global footprint
Analytical supplement to the article “Fires at Russian refineries: a chemical war with a delayed detonator”
Introduction
A spatial-dynamic model of an oil fire shows what falls out of the plume, where, and in what form during oil combustion; what “oil rain” actually is—and how dangerous it really is for people and the environment. In the first part, we analysed in detail the chemical composition of the smoke plume (Section 4), the cascade system of damage to the human body (Section 5), and applied the model to the real case of fires in Tuapse (Section 11). This supplement adds a spatial‑temporal axis: how toxins are distributed depending on distance, weather conditions, and geography.
Key principle. The real threat to human life and health exists in Zones 1–3 (0–300 km). Further away, concentrations drop by orders of magnitude, and we enter the realm of trace effects that require monitoring but not evacuation or the deployment of medical reserves.
Marine waters. For coastal refineries (Tuapse, Novorossiysk), a significant part of the plume can go out to sea depending on the wind direction. There is practically no inhalation exposure for people. Toxins are diluted by huge water volumes, settle in bottom sediments, are absorbed by plankton and algae, and undergo biodegradation. Photosynthetic organisms actively incorporate carbon and sulfur into their biochemical cycles. Risks for fisheries and coastal ecosystems exist, but this is not an acute toxic disaster for humans. The real threat is on land, where the plume covers settlements, farmlands, and water sources.
1. Zonal model: five types of fallout
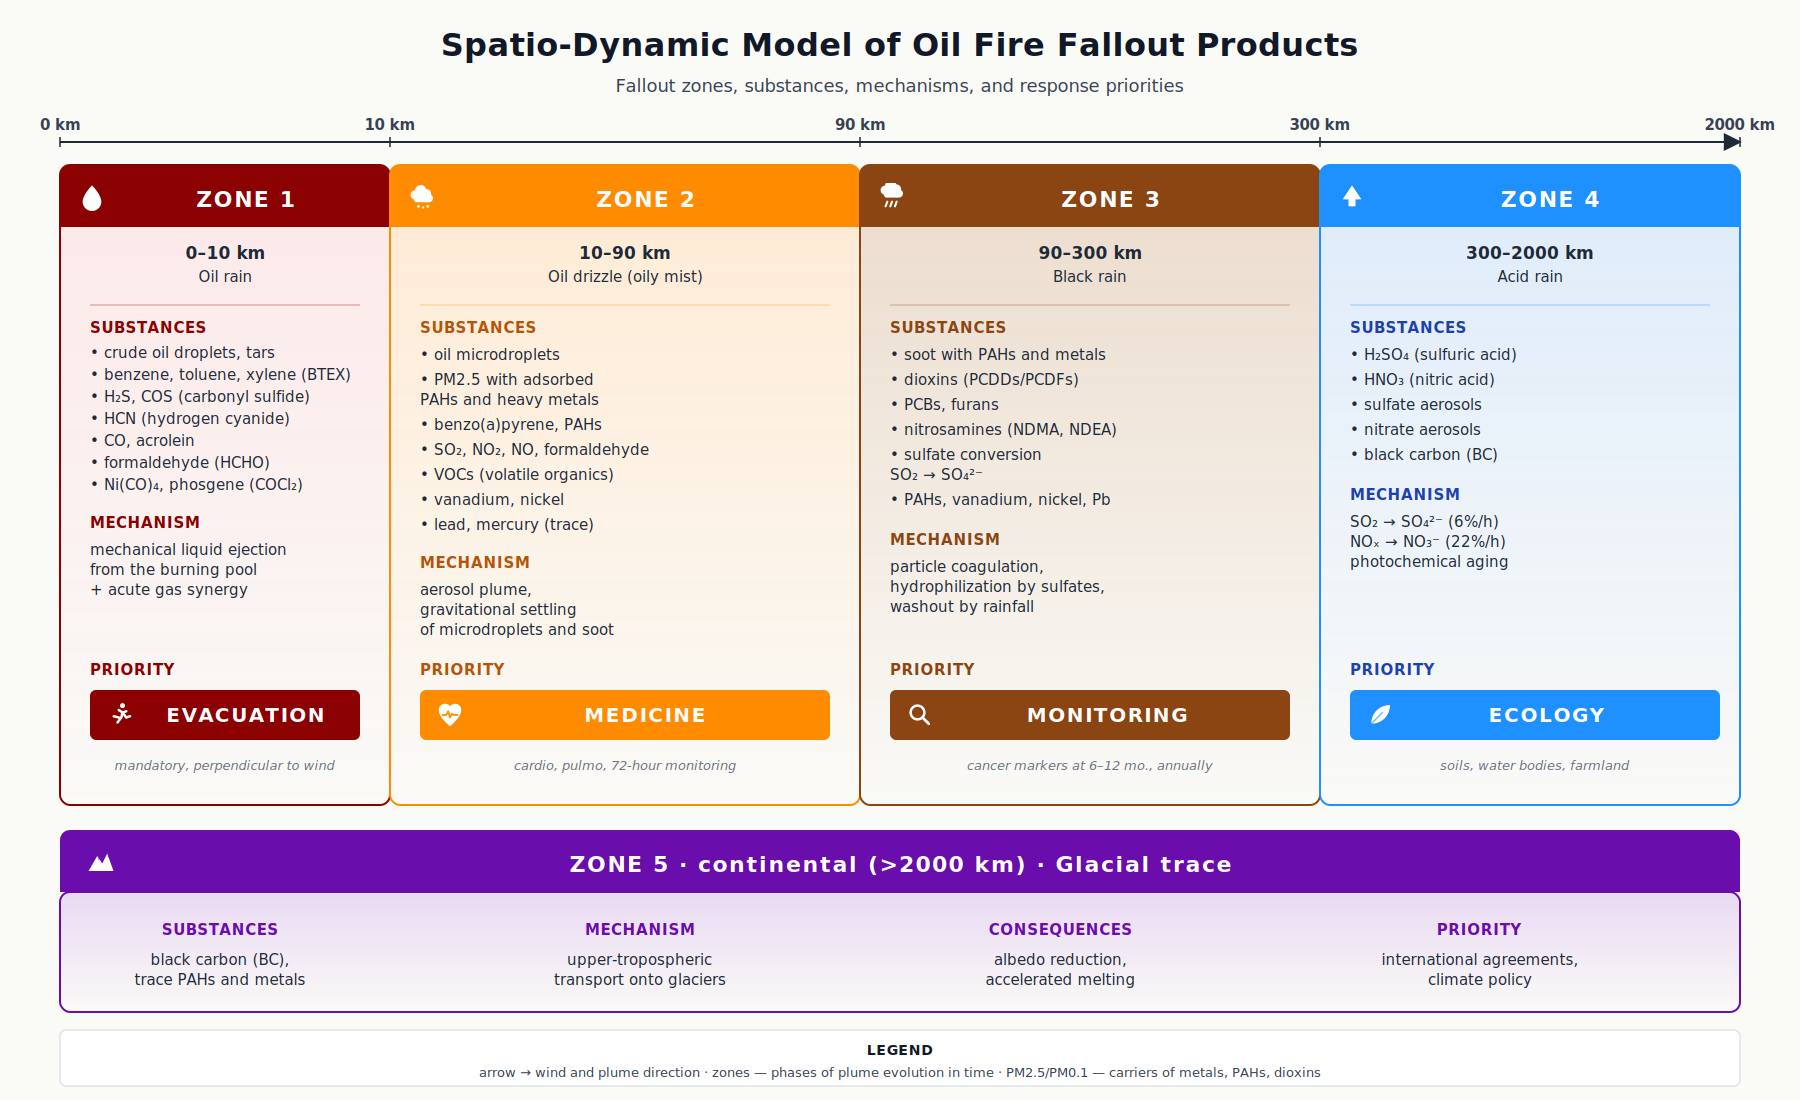
I divide the plume into five zones. Each zone has its own set of substances, fallout mechanism, and response priority.
Zone 1 (0–10 km) – “Oil rain”
Mechanism. Mechanical carry‑over of liquid from the burning pool (boilover, annular film). Large droplets of crude oil (>50–100 μm), resins, and fuel oil fall in seconds to minutes.
Substances. Along with the droplets – killer gases: H₂S, HCN, CO, COS. Acrolein, formaldehyde, phosgene, nickel and iron carbonyls. BTEX (benzene, toluene, xylene). Acrylonitrile. Volatile organic compounds (VOC).
Threat. Maximum. Synergy of H₂S, HCN and CO blocks cellular respiration. Death occurs from immediate to 10 minutes.
Response priority. Immediate evacuation perpendicular to the wind direction for 10–15 km. No filtering mask provides protection – isolated SCBA apparatuses are required.
Zone 2 (10–90 km) – “Oil drizzle”
Mechanism. Aerosol plume. Micro‑droplets of oil and PM2.5/PM0.1 particles rise higher, then settle gravitationally.
Substances. PM with adsorbed PAHs (benzo[a]pyrene), heavy metals (vanadium, nickel, lead, mercury), dioxins, furans, PCBs, nitrosamines. In the gas phase – SO₂, NOₓ, formaldehyde, residual acrylonitrile.
Threat. Very high. PM becomes a transport system – delivers toxins into the blood, causing systemic inflammation, thrombosis, heart attacks, strokes within the next 24–72 hours.
Response priority. Deployment of cardiological and pulmonological reserves. 72‑hour monitoring of evacuees.
Zone 3 (90–300 km) – “Black rain”
Mechanism. Coagulation of soot particles and their hydrophilization by sulphates. Particles become active condensation nuclei and are washed out by rain.
Substances. Soot with adsorbed dioxins, furans, PCBs, nitrosamines, heavy metals, PAHs. Sulphate conversion (SO₂ → SO₄²⁻).
Threat. Elevated chronic threat. Dioxins, PCBs, nitrosamines, heavy metals, benzene settle in soils and food chains. This is not about guaranteed consequences, but about an increased risk (under conditions of prolonged exposure) of cancer, immunodeficiency, teratogenesis, neurodegeneration over 5–20 years.
Response priority. Medical‑biological monitoring: oncological screening after 6–12 months and annually. Monitoring of food chains (fish, milk, vegetables).
Zone 4 (300–2000 km) – “Acid rain”
Mechanism. SO₂ → SO₄²⁻ (6%/h), NOₓ → NO₃⁻ (22%/h). Photochemical ageing of aerosol.
Substances. H₂SO₄, HNO₃, sulphate and nitrate aerosols. Black carbon (BC), trace PAHs, dioxins, heavy metals at low concentrations.
Threat. Moderate ecological impact. Concentrations are significantly lower than in Zone 3. Acid rain affects soils and water bodies, but this is a background process partially compensated by the natural buffering capacity of ecosystems.
Response priority. Environmental monitoring of soils, water bodies, agricultural lands.
Zone 5 (>2000 km) – “Glacier footprint”
Mechanism. Upper tropospheric transport. Only the finest black carbon particles and trace amounts of persistent organic pollutants reach these distances.
Substances. Black carbon (BC), trace dioxins, PCBs, heavy metals (ng/m³, pg/m³).
Threat. Global climatic impact. Black carbon on glaciers reduces albedo, accelerating melting. Background increases of persistent pollutants in the Arctic biota require monitoring.
Response priority. Scientific and climate monitoring. Climate policy.
Scheme 1. Spatial‑dynamic model of oil fire fallout. Five zones, substances, mechanisms, cascade levels, and response priorities.
2. Time dynamics: zones as phases of a single process
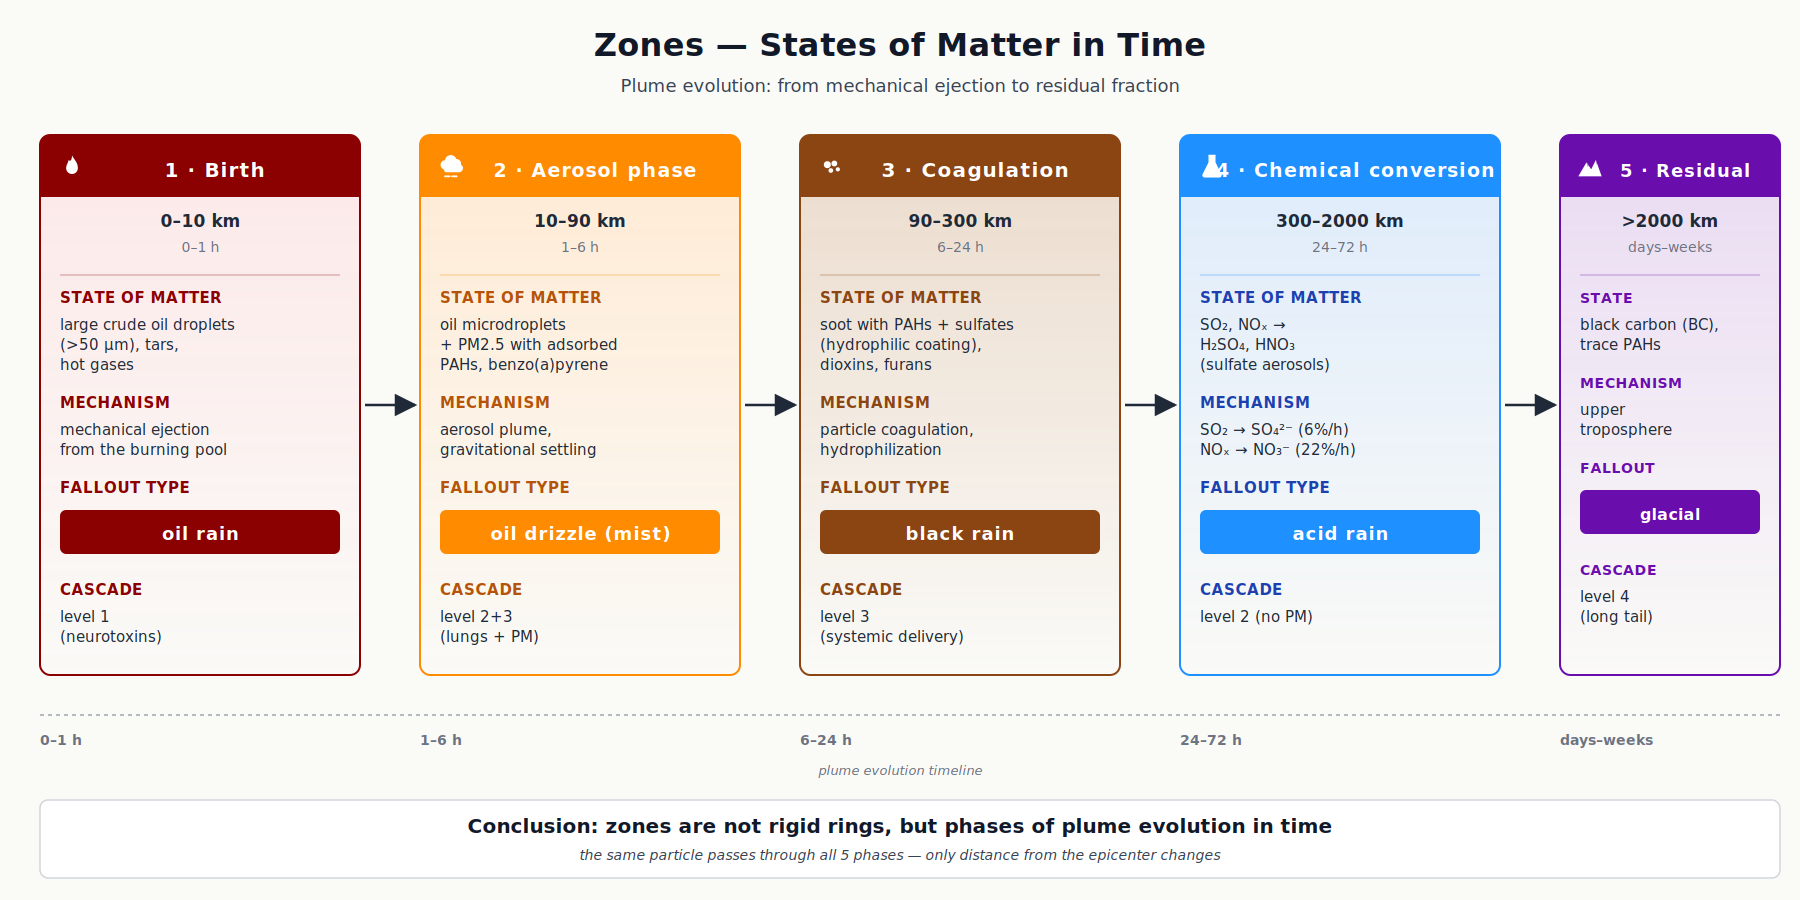
Zones are not static rings, but states of one particle over time. The same SO₂ molecule or soot particle travels through all five phases.
| Phase | Time | Distance | State of substance | Type of fallout |
|---|---|---|---|---|
| 1. Birth | 0–1 h | 0–10 km | large droplets (>50 μm), hot gases | oil rain |
| 2. Aerosol phase | 1–6 h | 10–90 km | micro‑droplets + PM2.5 with adsorbates | oil drizzle |
| 3. Coagulation | 6–24 h | 90–300 km | soot + sulphates, hydrophilic envelope | black rain |
| 4. Chemical conversion | 24–72 h | 300–2000 km | SO₂ → H₂SO₄, NOₓ → HNO₃ | acid rain |
| 5. Residual fraction | days–weeks | >2000 km | black carbon BC, trace PAHs | glacier footprint |
Concentrations decrease with distance approximately as the inverse square of the distance. What is measured in ppm and mg/m³ in Zone 1 becomes ppb and μg/m³ in Zone 3, and ppt and ng/m³ in Zone 5.
Scheme 2. Zones are states of matter in time. Evolution of the plume from mechanical carry‑over to the residual fraction.
3. Predictive framework: how to forecast the scenario
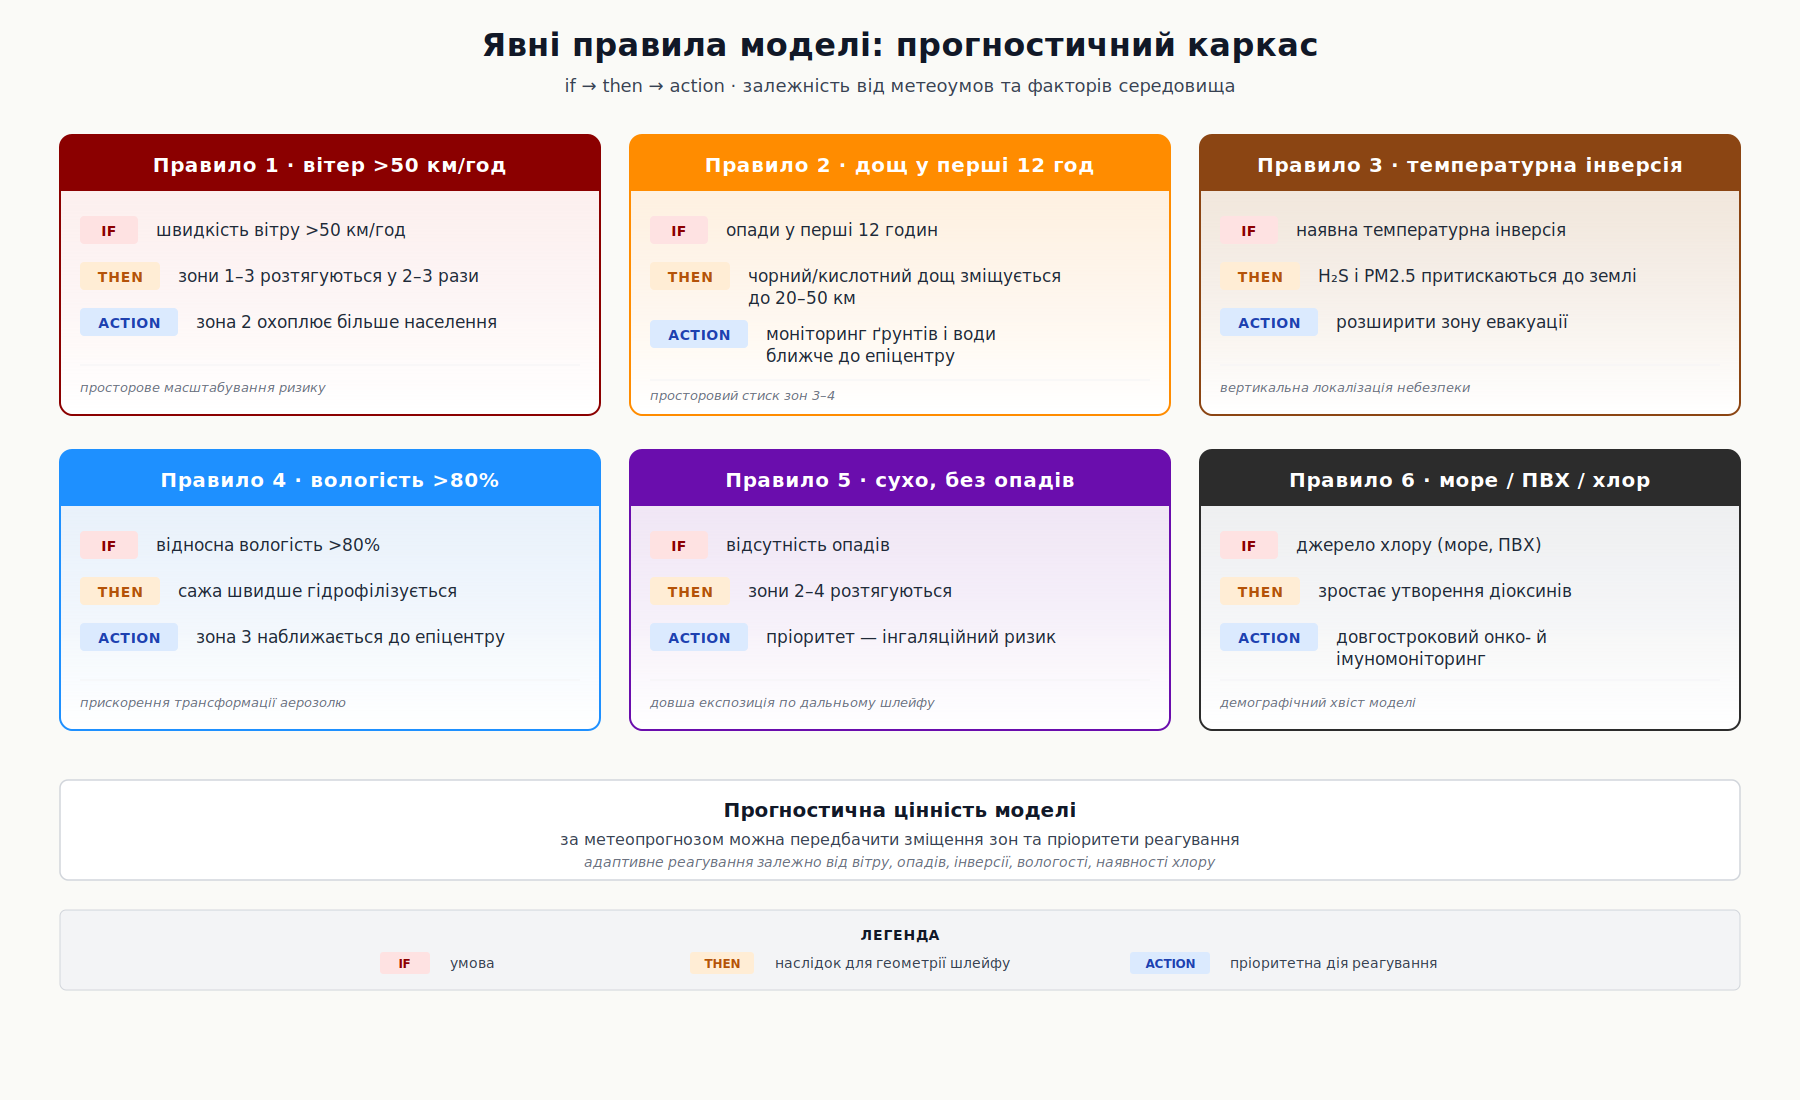
Based on the model, we formulate six explicit rules. They allow, using the weather forecast and the characteristics of the burning facility, to predict the shift of zones and the response priorities.
| Condition (IF) | Consequence (THEN) | Action (ACTION) |
|---|---|---|
| Wind >50 km/h | zones 1–3 stretch 2‑3 times | zone 2 covers more population |
| Rain within first 12 h | black/acid rain shifts to 20–50 km | monitor soil and water closer to the epicentre |
| Temperature inversion | H₂S, HCN, CO, PM2.5 are pressed to the ground | expand the evacuation zone |
| Humidity >80% | soot hydrophilises faster | zone 3 approaches the epicentre |
| Dry, no precipitation | zones 2–4 stretch | priority – inhalation risk |
| Presence of chlorine (sea, PVC) | increased formation of dioxins, PCBs | long‑term oncology and immunity monitoring |
These rules make the model predictive. Even before the plume reaches a city, one can determine the priorities: evacuation, medical reserves, environmental monitoring, or climate policy.
Scheme 3. Explicit rules of the model: predictive framework. if → then → action – dependence on weather conditions and environmental factors.
4. Integrated pipeline: from source to consequences
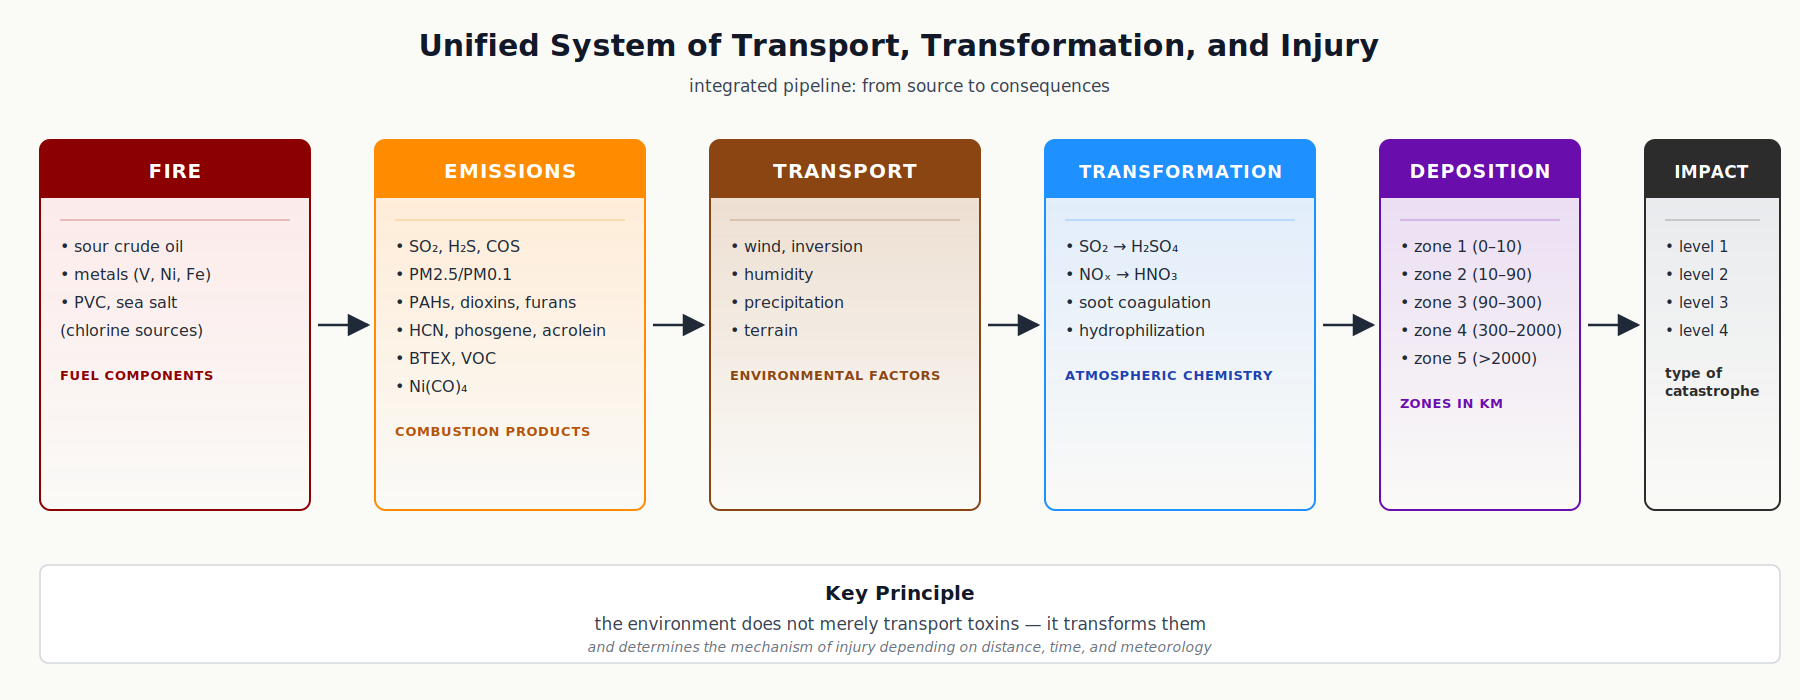
All of this is a single system. No stage can be considered separately.
Fire (sulphurous oil, metals, chlorine) → Emission (SO₂, H₂S, HCN, CO, PM, PAHs, dioxins, PCBs, BTEX, acrylonitrile, phosgene, carbonyls, heavy metals) → Transport (wind, humidity, inversion, precipitation) → Transformation (SO₂→H₂SO₄, coagulation, hydrophilisation) → Fallout (zones 1–5) → Damage (cascade levels 1–4, type of disaster).
Key principle. The environment does not just transport toxins – it transforms them and determines the damage mechanism depending on distance, time, and weather conditions. Real impact is determined not only by the emission but also by the environment.
Scheme 4. Unified system of transport, transformation and damage. Integrated pipeline from source to consequences.
5. Impact intensity and hazard gradation
The impact intensity decreases sharply with distance from the source. In Zone 1 it is an acute threat to life on a time scale of minutes. In Zone 2 – high medical threat manifesting over hours and days. In Zone 3 – already an elevated long‑term risk (under conditions of prolonged exposure) that appears over years. In Zone 4 the impact becomes moderate and primarily ecological. In Zone 5 a background level of impact with a climatic scale forms.
In distant zones it is important to distinguish between actual effects and probabilities. We are not talking about guaranteed consequences, but about an increased risk of cancer, immune, and teratogenic effects in the long term. These risks materialise only under conditions of prolonged exposure and the incorporation of pollutants into food chains.
Not all toxins reach distant zones. A significant part of the substances dissipates in the atmosphere, degrades under photochemical processes, settles at shorter distances, or transforms into less active forms. Some are incorporated into biogeochemical cycles even before reaching zones 3–5. This leads to an additional reduction of real concentrations in remote regions.
The open sea does not create conditions for mass inhalation exposure. In marine environments, processes of dilution, sedimentation into bottom deposits, biodegradation, and incorporation of substances into food chains through plankton and algae dominate. This forms a different type of impact – not acute toxic, but ecological, with potential consequences for biota and fisheries, but without an immediate threat to human life in the short term.
Thus, the danger is non‑linear and decreases rapidly with distance. The main threat to human life and health is localised in zones 1–3, while in distant zones background, ecological, and long‑term processes dominate, which require monitoring but not emergency response measures.
6. Conclusions
Zone 1 (0–10 km). Maximum threat. Death from H₂S, HCN, CO within minutes. Evacuation. SCBA.
Zone 2 (10–90 km). Very high threat. Heart attacks, strokes, pulmonary oedema within a 24–72 hour window. Cardiology, pulmonology. 72‑hour monitoring.
Zone 3 (90–300 km). Elevated chronic threat. Increased risk (under prolonged exposure) of cancer, immunodeficiency, teratogenesis over 5–20 years. Medical‑biological monitoring. Monitoring of food chains.
Zone 4 (300–2000 km). Moderate ecological impact. Concentrations significantly lower. Acid rain affects soils and water bodies. Environmental monitoring.
Zone 5 (>2000 km). Trace concentrations. Main problem – climatic (soot on glaciers). Scientific and climate monitoring.
Marine waters. For coastal refineries, the plume may go out to sea. There is practically no inhalation exposure. Toxins are diluted, biodegraded, absorbed by plankton and algae. Risks for fisheries and ecosystems exist, but this is not an acute disaster for humans. The real threat is on land.
Practical summary. Response protocols must be differentiated by zone and adaptive to weather conditions. The real fight for human life and health is in zones 1–3. Beyond that – monitoring, science, policy.
References
- First part: “Fires at Russian refineries: a chemical war with a delayed detonator” (Sections 4, 5, 11).
- Hobbs P.V., Radke L.F. (1992). Airborne Studies of the Smoke from the Kuwait Oil Fires. Science 256(5059):987–991.
- Bakan S. et al. (1991). Climate response to smoke from the burning oil wells in Kuwait. Nature 351:367–371.
- Aurell J., Gullett B.K. (2010). Aerostat sampling of PCDD/PCDF emissions from the Gulf oil spill in situ burns. Environ. Sci. Technol. 44(24):9431–9437.
- CEOBS (2026). Black rain: the health and environmental risks from Tehran’s oil fires.
- Data from Rospotrebnadzor on exceedances of MPC for benzene and xylene in Tuapse (April 2026).
Author: Vladislav Balinsky, chemist, biologist, head of NGO “Green Leaf”.
Original publication (Ukrainian): Green Leaf – Eco Newspaper of Odesa
New Vegetable-Oil Spill in Chornomorsk: Environmental Disaster Repeats Itself
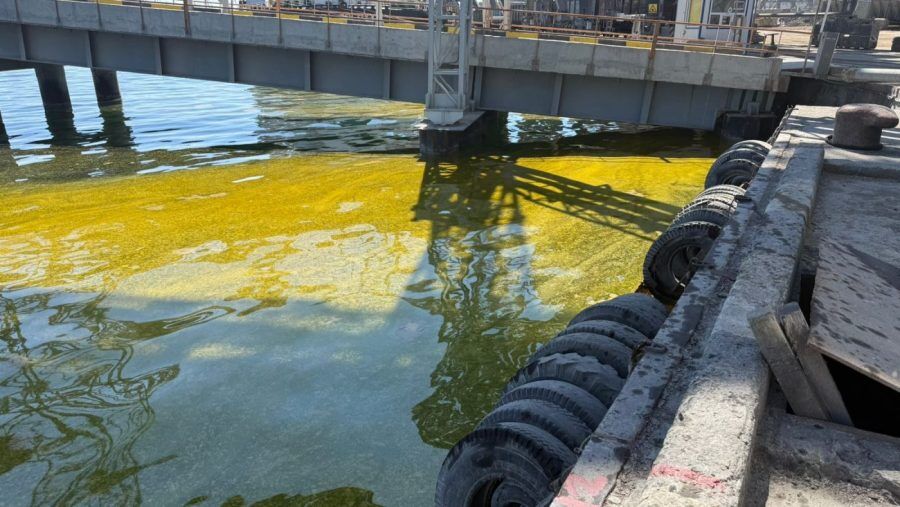
On April 26, 2026, an oil spill in Chornomorsk occurred as a result of a Russian strike on port infrastructure: tanks containing sunflower oil were damaged at the Chornomorsk Commercial Sea Port. According to data from the StateEnvironmental Inspectorate of the South-Western District, a tank with a capacity of about 6,000 tonnes was destroyed during the fire, causing oil to spill both on port territory and into the waters of the Sukhyi Estuary.
Read More
The Third Spill in Two Years: What the New Oil Catastrophe in Odesa Bay Means
Vladyslav Balinskyi, biologist and journalist, Zeleny Lyst (Green Leaf)
27 April 2026
On 8 June 2024, I was standing on Sobachyi beach listening to frogs.
The Kakhovka dam had been blown up two days earlier. From that moment I tracked the movement of the surface plume — and on the 8th it reached Odesa. Past me floated rooftops, entire islands of trees and reeds with birds sitting on their nests, refrigerators, construction debris, animal carcasses. The Dnipro had come to the Black Sea and the sea turned fresh. Frogs were calling on the beach. For Odesa, it was surreal.
About ten days later, when the water had somewhat settled, I took my camera and dived. I have been studying Odesa Bay since 1996 and know this seabed well. The mussel banks were covered with a solid layer of organic sediment. Mass die-off of colonies. I thought then that this was already a systemic process — mussels filter the water throughout the entire bay, and I did not know the scale of this death. I documented all of it on video. It was my first documentation of the consequences of the Kakhovka dam destruction for the biocenoses of Odesa Bay.
I recall this now because on 27 April 2026, looking at satellite images, I was thinking about the same thing — about boundaries that are still unknown.
On 26 April, Russian drones struck the port of Chornomorsk and destroyed a tank containing sunflower oil. One point deserves emphasis: sunflower oil is a food product, an agricultural commodity, and has no connection whatsoever to military infrastructure. A strike on storage facilities holding a civilian food product, with foreseeable catastrophic environmental consequences, is precisely what is called ecocide. According to the State Environmental Inspection of the South-Western District, approximately 6,000 tonnes of oil entered the port basin, then Sukhyi Lyman, then the sea. This is already the third major oil spill in the Odesa region in under two years.
The following morning my phone filled with questions. Telegram was full of alarm and short on facts. I opened Sentinel Hub.
To assess the area of contamination I used Copernicus satellite imagery in SAR mode (C-band, VV polarisation). An oil film on the sea surface suppresses backscattering of the radar signal and appears on imagery as a dark anomaly against normal wave texture. Official services recorded a slick directly in the port basin measuring 400 by 200 metres — at the time of the first inspection, booms were still containing the spill. On imagery the following morning, after an offshore wind had driven the oil into open water, I estimate the total area of contamination of the sea surface at approximately 40 square kilometres — and this does not include the area of Sukhyi Lyman. The slick continues to move.
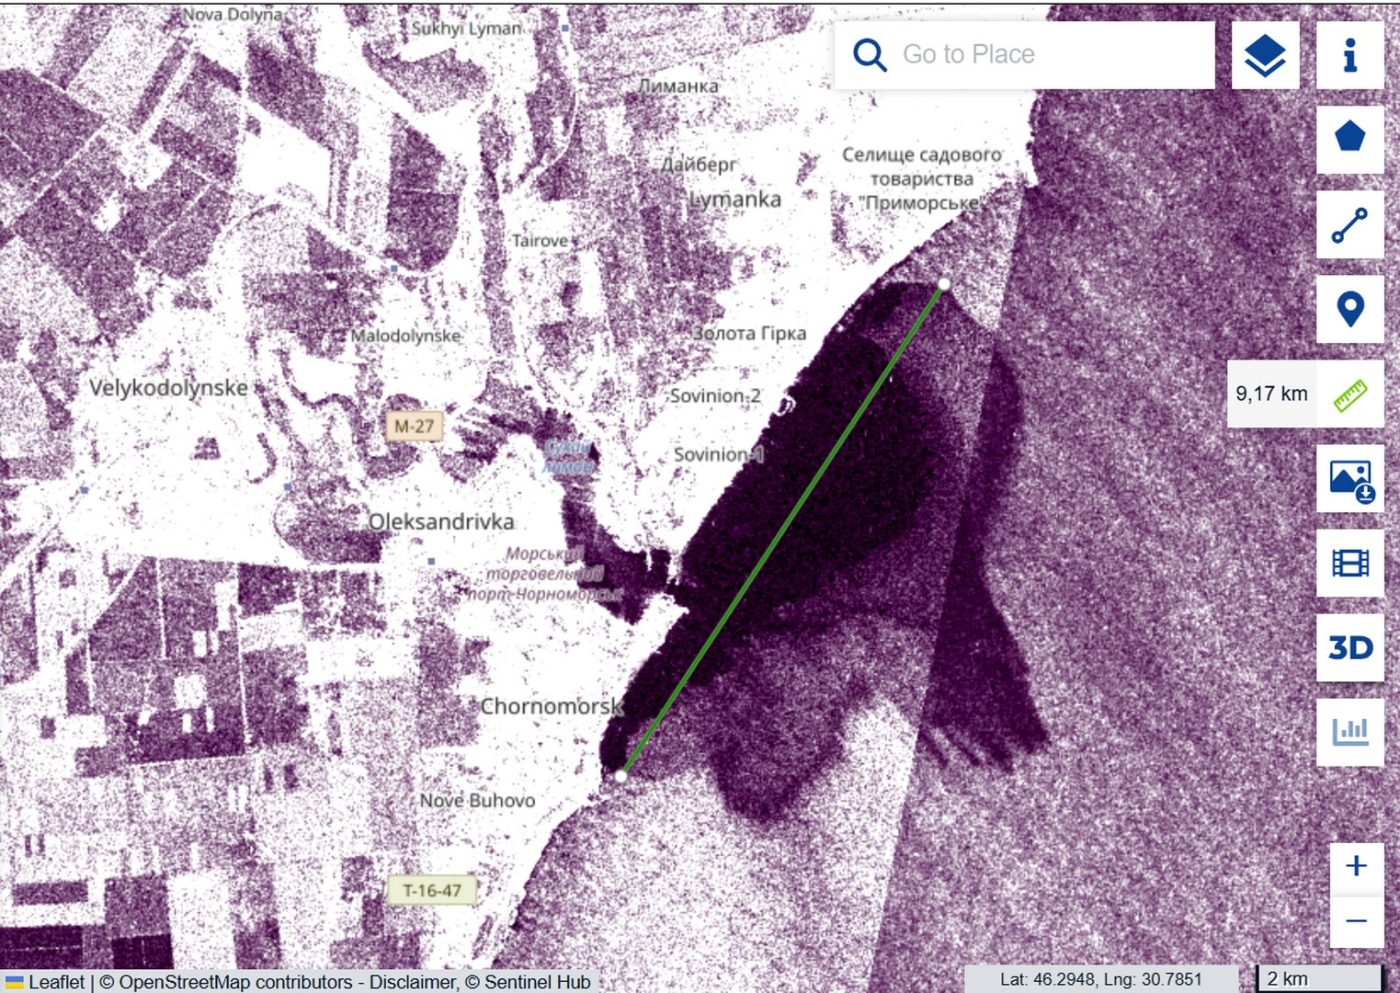
Fig. 1. SAR image, Sentinel Hub Copernicus (C-band, VV polarisation), Chornomorsk port area and adjacent sea. 27 April 2026, first time frame. Measured anomaly length — 9.17 km. The dark area corresponds to radar signal suppression by the oil film. Source: Sentinel Hub EO Browser, author’s own measurements.
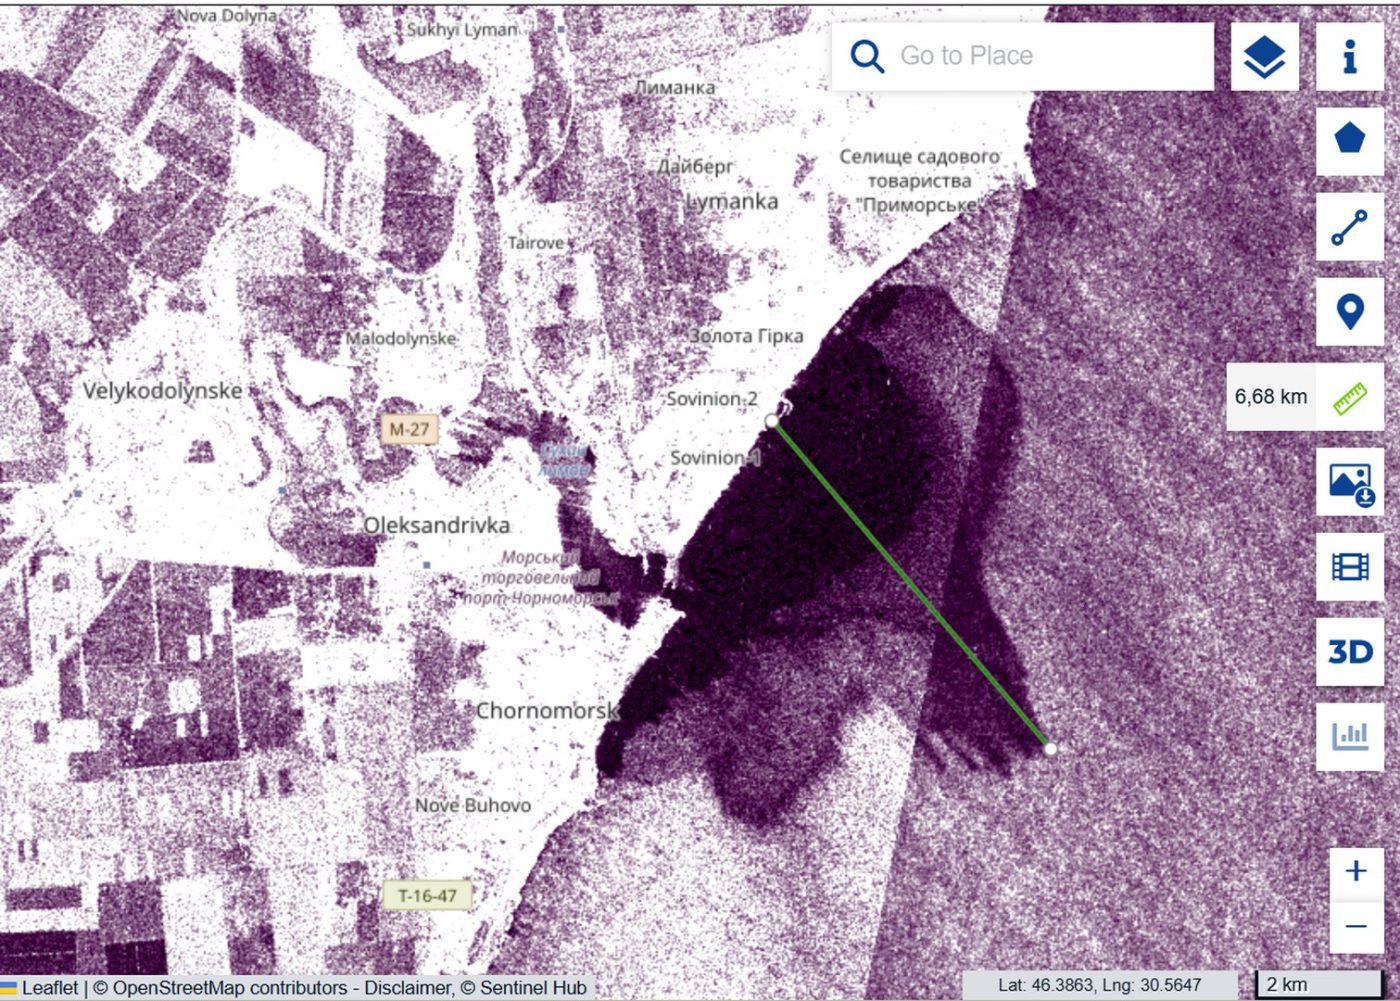
Fig. 2. SAR image, Sentinel Hub Copernicus (C-band, VV polarisation), Chornomorsk port area and adjacent sea. 27 April 2026, second time frame. Measured anomaly length — 6.68 km. The change in slick configuration reflects wind-driven transport dynamics. Source: Sentinel Hub EO Browser, author’s own measurements.
The direction of movement is determined by wind. According to data from the Ukrainian Hydrometeorological Centre and Sinoptik, on 25–26 April a strong offshore westerly and north-westerly wind prevailed over the bay, 12–18 m/s with gusts to 22 m/s. It pushed the oil away from shore into open water, where no boom system can collect it. By the night of the 27th the wind had begun to shift to south-easterly — Meteoblue forecasts gusts to 23 mph. For Odesa Bay this is an onshore direction; it drives surface masses back toward the coast and further toward Tuzlivski Lymany.
I have seen what happens after such a shift.
To understand what comes next, it is necessary to know what came before.
October 2024: the first major spill — 125 tonnes of oil into Sukhyi Lyman following a drone strike by the Russian Federation on port infrastructure. The State Environmental Inspection documented damages of 10.9 billion hryvnias. Birds died.
December 2025: Russian Shahed drones struck port Pivdennyi and destroyed an oil-processing terminal. Again sunflower oil — again a civilian food product, again a foreseeable environmental strike. Thousands of tonnes entered the Black Sea — the precise volume remains unknown, as meaningful marine monitoring is impossible under wartime conditions. Satellite data showed contamination reaching up to 730 square kilometres. Scientists stated that no spill of vegetable oil on this scale had ever been documented in the scientific literature.
What followed I observed personally along the Odesa coastline. In parallel, Dr Ivan Rusyev, Head of the Scientific Department of Tuzlivski Lymany National Nature Park, documented the situation from his end every day and published field data on his Facebook page — the picture was assembled from two ends of the same shoreline. According to Ivan Rusyev’s estimate, approximately 5,000 birds died between December and February. After the storm of 6 February, remnants of polymerised oil covered the park’s sandbar over an area of approximately 10,000 square metres. Thousands of crabs of four species were washed ashore.
On 27 January, along the coastline from Lanzheron to the 16th station of Velykyi Fontan — dead seahorses in a continuous carpet, up to 35 individuals per square metre. Hippocampus guttulatus, a species listed in the Red Book of Ukraine, whose population in the bay had only begun to recover from 2017. The official explanation was storm. But if the current had been strong enough to tear a living seahorse from its substrate, it would also have torn away mussel clusters and seagrass. None of that was present among the wrack. The storm carried ashore those who had already died earlier.
As a biologist I will explain the mechanism, because it is not obvious.
Vegetable oil does not poison the water — it is not toxic in the classical sense. But within a few weeks, under the influence of sunlight, oxygen and salt, it polymerises and sinks to the seabed. It accumulates in depressions between rocky ridges — precisely where seahorses overwinter and where mussel banks grow. Mussels absorb this mass through filtration. Seahorses in a state of winter torpor are, in my hypothesis, suffocated when storm-resuspended mass blocks their delicate gill apparatus. This is a working hypothesis based on field observations — it requires laboratory confirmation, but I have nothing better to explain what I observed in January.
For birds the mechanism is different. Oil mats the feathers and destroys their insulating and water-repellent properties — the bird sinks and freezes in any water temperature. After months of practical work alongside ornithologists I reached a conclusion that sounds counterintuitive: vegetable oil appears to be more dangerous for birds than fuel oil. Fuel oil can be washed off. Vegetable oil, by all indications, damages feather structure more deeply and more permanently — at least that is what the evidence shows in practice.
After the December disaster I published a rescue algorithm on Facebook: how to collect birds, how to wash them with dish soap, how to keep them for two weeks. People acted. But here a methodological point matters: the zoo transferred birds to volunteers and counted them as saved. Genuine rescue, however, means returning a bird to the wild — not transferring it between people. According to our observations, no more than 5% of birds counted as “saved” actually returned to the wild. Vegetable oil damages feather structure in ways that no washing can fully repair. If you want to help now — document the locations of slicks and pass the coordinates on. That is material that works over the long term.
Based on what I observed after the December disaster, I can outline the most likely risks — not a forecast, but reference points for observation.
The coming weeks: the most acute threat concerns birds. Late April and May represent the peak of spring migration and the start of nesting. The onshore south-easterly wind is already carrying contaminated water toward shore, and the first oiled individuals will most likely appear within days.
Two to four months: the physical process of oil polymerisation and sedimentation to the seabed is well established. The extent to which this will affect the benthic biocenoses of Odesa Bay depends on the actual volume that entered the sea and on hydrodynamic conditions that are difficult to forecast at this stage.
Autumn–winter 2026/2027: the most dangerous horizon. Following the December 2025 disaster, we recorded mass mortality of seahorses in January. Whether a direct causal link exists between these events through lipid sediment deposition is my working hypothesis, requiring verification. If it holds, autumn storms resuspending bottom sediments could become a critical factor for benthic organisms during their winter torpor.
Tuzlivski Lymany NNP: after the December disaster, the first wave of contamination reached the park after seven weeks. Prevailing currents in the spring-summer season carry surface masses southward and south-westward. There are grounds to expect a repeat of this scenario, though timing and scale will depend on wind patterns over the coming weeks.
October 2024. December 2025. April 2026. Mussels after Kakhovka. Seahorses in January.
Three strikes on civilian food infrastructure. Three spills of a food product into the sea. A foreseeable environmental outcome each time. These are not collateral damages — this is a documented pattern.
I have been studying this bay since 1996 and hold a video archive of its condition across different years. Comparing what it was with what is happening now — that is my work.
Every photograph, every GPS coordinate of a slick, every SAR image is material for documentation under the Bucharest Convention on the Protection of the Black Sea, the UNEP mandate on environmental consequences of armed conflict, and Ukraine’s efforts toward the recognition of ecocide as an international crime. Collect it.
Vladyslav Balinskyi, biologist and journalist, Zeleny Lyst
Odesa, 27 April 2026
SAR imagery: Sentinel Hub Copernicus, C-band VV, Chornomorsk sea area, 27 April 2026. Author’s own materials.
Fires at Russian Refineries: Chemical Warfare with a Delayed Detonator
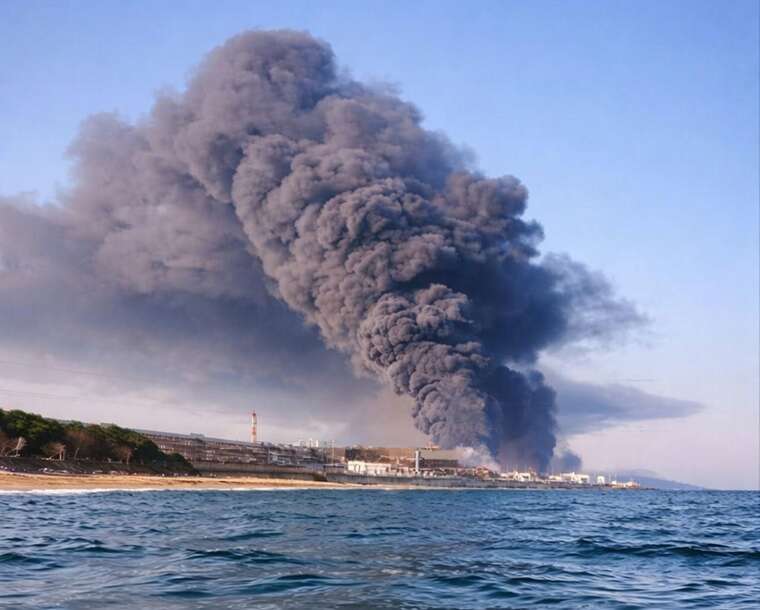
The string of fires and explosions at Russia’s oil-refining facilities in 2024–2026 has become a phenomenon that goes beyond mere military statistics. This is chemical warfare with a delayed effect, where every Ukrainian Armed Forces strike on Russian oil infrastructure sets off a chain of long-term contamination.
We are witnessing the systemic degradation of Russia’s oil infrastructure — from local fires in 2024 to large-scale damage to ports and pipelines in 2026. Spatial analysis shows that the strikes are concentrated in European Russia — from Kirishi and Ryazan to Samara, Volgograd, Tuapse, and Novorossiysk. These are the nodes that form the axis of chemical loading, where combustion products, heavy metals, dioxins, and polycyclic aromatic hydrocarbons (PAHs) accumulate.
Repeated strikes against the Ryazan, Samara, and Volgograd refinery clusters create a zone of chronic contamination covering densely populated regions of the Volga basin. The southern terminals — Tuapse, Novorossiysk, Taman — are turning into hubs of combined contamination, where petroleum products mix with sea salts and plastics to produce toxic compounds with long-lasting effects.
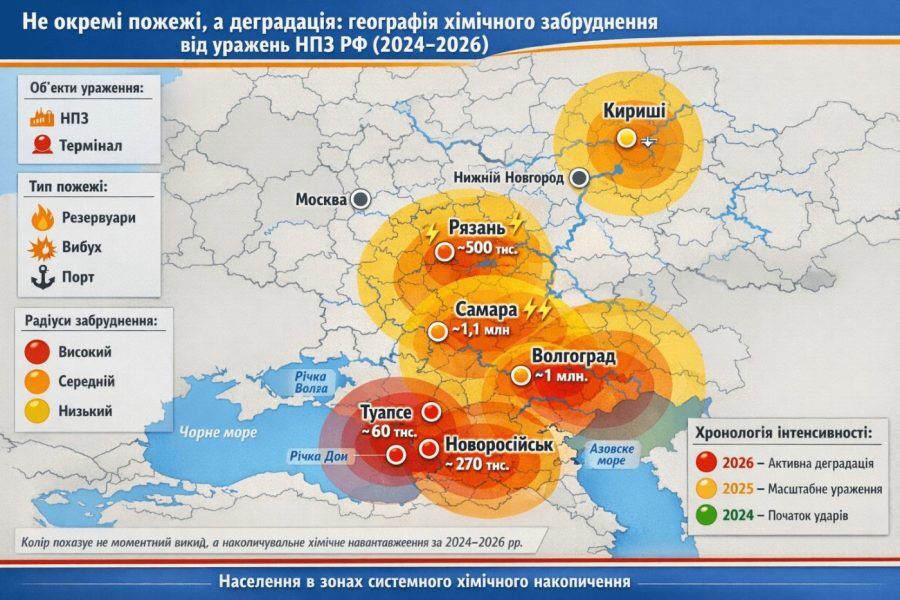
The chronology testifies to a transition from isolated incidents to a systemic ecological crisis: every fire not only destroys productive capacity but also launches a process of toxic accumulation in soil, water, and the atmosphere. The consequences extend far beyond industrial zones and reach the ecosystems of the Black and Caspian seas.
This is not merely a geography of fires; it is a portrait of gradual chemical exhaustion that grows deeper and more dangerous for the ecosystems of Eastern Europe with each passing year. A full register of accidents and fires at Russian refineries and energy-sector facilities — including those caused by Ukrainian strikes — is provided in the annex at the end of the article.
Tuapse: a Double Strike and an Ecological Crisis
On 16 and 20 April 2026, drones struck Russia’s Krasnodar Krai. The targets reportedly included the seaport and the oil refinery in Tuapse. Eyewitnesses reported a series of explosions in the Tuapse, Gelendzhik, and Anapa areas. A large-scale fire broke out in the seaport’s territory; analysts at the Astra Telegram channel recorded more than ten ignition points in the tank farm of the Tuapse refinery. After the strike on the night of 16 April, Russian rescuers spent several days extinguishing the fire.
The Tuapse refinery is one of Russia’s largest, specialising in primary crude processing. It belongs to Rosneft and operates jointly with the maritime terminal. Its capacity is approximately 12 million tonnes of crude per year; a substantial share of output is exported.
After the 20 April strike, the fire at the maritime terminal continued for several days.
On Thursday, 23 April, the Krasnodar Krai operational headquarters advised residents of Tuapse not to leave their homes unnecessarily and not to open windows. Rospotrebnadzor recorded benzene, xylene, and soot concentrations in the air exceeding maximum permissible levels by a factor of two to three. Residents were advised to perform wet cleaning more frequently, rinse their nose, eyes, and throat, and to wear masks when going outside.
Smog from the fire reached Stavropol, and on 22 April — according to ecologist Georgiy Kavanosyan — it reached Sochi. Local residents complained on VKontakte communities about “oil rain”, posting photos of contaminated land, dogs, and birds, and discussing how to protect themselves from petroleum products that are now everywhere — even in drinking wells. They mocked official statements that pollutant concentrations “do not exceed the norm” and complained about inaction by officials at every level.
The Moscow Times has cited ecologists’ assessments. Yevgeny Vitishko called the events “the largest ecological catastrophe in the region” of recent times — capable of harming the environment for several years to come. The Soviet-era chemist Vil Mirzayanov — a participant in the Novichok development programme and the first person to publicly reveal its existence, back in 1992 (it was Novichok that, according to international investigations, was used to poison Alexei Navalny in 2020) — warned that the combustion products contain polyaromatic compounds, including carcinogens hazardous to human health. One ecologist who asked to remain anonymous noted that part of the harmful emissions may fall as acid rain — Tuapse residents had already documented precipitation with an oily film and black particles on the streets.
When It Is Not Just Oil Burning
A large-scale fire at a facility storing or processing sour crude is not merely a big blaze. It is a full-fledged chemical catastrophe with a fundamentally different hazard profile from burning wood, coal, or even ordinary crude. Instead of “smoke plus soot,” what forms is a multi-component toxic environment containing nerve agents, acids, delayed-action asphyxiants, and ultra-persistent carcinogens.
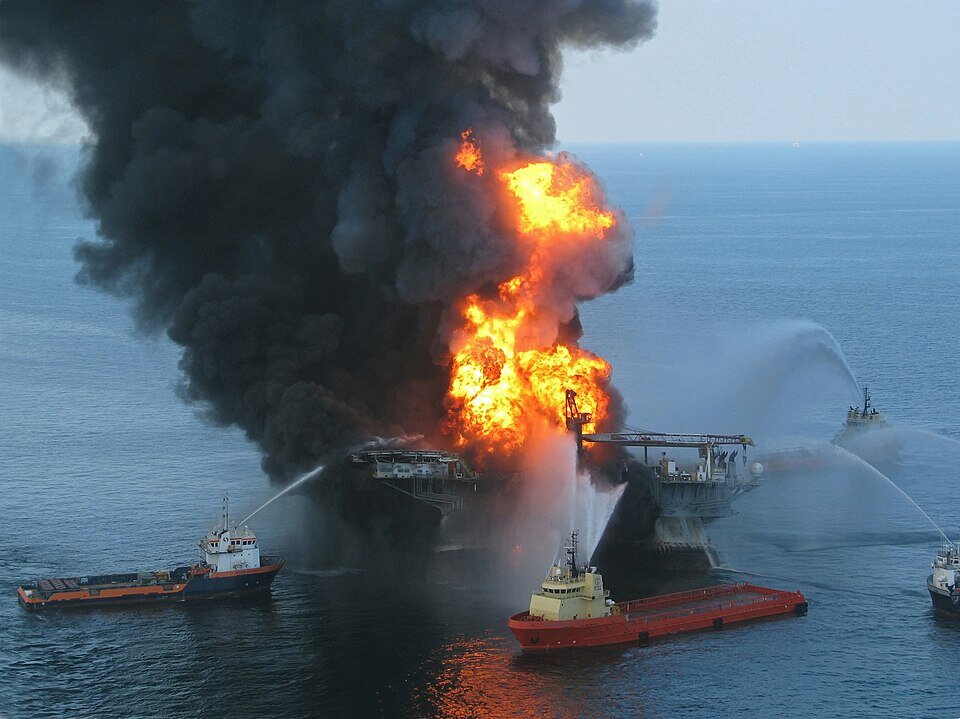
History already provides analogues: the Kuwaiti oil-well fires of 1991, the Deepwater Horizon explosion and spill of 2010, and accidents at the Ufa refinery. After each of these events, morbidity in affected regions rose for 5–10 years, while soil and water remained toxic for generations.
The Russian context adds another dimension: the Russian oil industry is not a purely civilian sector. It is part of a closed cycle that fuels the army and supplies the defence-industrial complex with explosive precursors and rocket-fuel components. That is why the question “what is burning in Tuapse” extends far beyond ecology.
Who, Where, When, and How Severely Will Be Affected
Before turning to toxicology, the limits of the claims must be drawn honestly. A fire is not a “cloud of death” that uniformly blankets everything around it. Its impact has a clear geometry and unfolds in stages. Every claim that follows must therefore be read across three simultaneous dimensions — geographical, temporal, and medical.
Where (the geography of harm)
Acute toxic loading is high only within a specific sector, defined by a combination of meteorological factors:
- Wind direction and speed — the principal factor. The hardest-hit population centres are those on the leeward side of the epicentre. In the first hours, the upwind side often receives many times less poison.
- Humidity and temperature inversion. High humidity combined with inversion presses the smoke plume to the ground, raising near-surface concentrations several-fold.
- Precipitation. Rain inside the plume is not atmospheric cleansing; it is concentrated acid-organic fallout onto soil, roofs, and farmland. It can fall tens of kilometres from the fire itself.
- Terrain. Valleys, depressions, and lowlands accumulate gases heavier than air (H₂S, SO₂, metal carbonyls) — like an open well.
Indicative response zones:
- 0–10 km on the leeward side — acute injury; mandatory evacuation.
- 10–50 km — air monitoring, evacuation of risk groups, indoor-shelter regime.
- 50–300 km — the plume disperses, but heavy-metal, PAH, and dioxin fallout may settle in patches and be re-mobilised by subsequent rain.
- Hundreds to thousands of kilometres — no longer about acute intoxication, but about transboundary transport of persistent organic pollutants and heavy metals.
When (the timeline)
- Minutes to hours: H₂S, HCN, CO, acrolein. Acutely lethal in the near radius.
- 24–72 hours: phosgene, metal carbonyls — delayed death from pulmonary oedema after evacuation.
- Days to weeks: cardiovascular exacerbations driven by PM2.5; asthma flares; heart attacks in risk groups.
- Months to years: chronic respiratory disease, immune disorders, depression.
- Decades: oncology, teratogenesis, degraded soil and water bodies, dioxin accumulation in food chains.
Who (differential vulnerability)
The notion that “everyone breathes the smoke equally” is a fallacy. The same air imposes very different burdens on different people, and this must be stated plainly:
- Children. Higher breathing rate, thinner mucous membranes, a developing CNS. Toxin dose per kilogram of body mass is two to three times higher than for adults.
- Pregnant women. The placenta is not a barrier to PM or dioxins; risk of miscarriage, growth retardation, and birth defects rises.
- The elderly. Reduced toxin clearance, rigid vasculature, diminished pulmonary reserve. Risk of heart attack and stroke spikes in the first days.
- Patients with chronic disease — asthmatics, COPD, diabetics, cardiovascular and oncological patients, those with immunodeficiencies. For them, levels “tolerable for the healthy” may be fatal. The specific prognosis is always individual, tied to diagnosis, stage, and concurrent therapy.
- Healthy adults — the most resilient group, but they too receive a dose of persistent toxins whose effects will surface years later.
The framing conclusion. When discussing the consequences of a specific fire, one must always distinguish geographical sector, temporal horizon, and vulnerability group. Without this, any figure is either panic-mongering on empty ground or an underestimation of a real catastrophe.
Why Sour Crude Is More Dangerous Than Ordinary Oil
Russian Urals-grade crude is among the heavy and sour grades — its sulphur content is approximately 1.2–1.5%, which makes it less ecologically benign and more expensive to refine compared with lighter grades (Brent, Ukrainian Diamant Nafta).
Ordinary crude, when it burns, yields CO, CO₂, soot, and a little SO₂. All bad — but predictable. Sour crude is an entirely different category of risk, for three reasons.
First — high sulphur content. Sulphur in crude (mercaptans, sulphides, thiophenes, thiols) follows two fundamentally different, parallel pathways during combustion, depending on the local conditions inside the flame:
- In oxygen-rich zones (bright flame), oxidation dominates: organic sulphur + O₂ → SO₂, with some SO₃. In the atmosphere, after absorbing moisture and undergoing photochemical transformation, SO₂ produces sulphurous and sulphuric acid — the basis of acid rain.
- In oxygen-depleted, reducing zones (smouldering, pyrolysis on the “rich” side of the flame, periphery of the smoke plume), thermal decomposition of sulphur-organics dominates: the principal products are hydrogen sulphide (H₂S), mercaptans, and carbonyl sulphide (COS).
This is not a chain “sulphur → H₂S → SO₂”; these are two distinct streams of poison that arise simultaneously in different parts of the same fire. They differ in chemistry, in their mechanism of action on the human body, and in their environmental fate:
| H₂S | SO₂ (and derivatives H₂SO₃/H₂SO₄) | |
| Sulphur oxidation state | Reduced (−2) | Oxidised (+4/+6) |
| Conditions of formation | Pyrolysis in oxygen-poor zones | Oxidation in oxygen-rich zones |
| Principal mechanism of harm | Neurotoxin; blocks cytochrome oxidase → cellular respiration shutdown | Irritant/corrosive → chemical burn of airways, bronchospasm |
| Environmental fate | Slow atmospheric oxidation to SO₂; local poisoning of soil and water by sulphides | Acid rain; acidification of soils and water bodies over wide areas |
In other words, a sour-crude fire releases simultaneously a fast-acting nerve poison and a slow corrosive acid. Protection and response measures for each are different.
Second — metals in the crude. Vanadium, nickel, and iron are not merely “contaminants.” They are catalysts: they accelerate the formation of dioxins, generate metal carbonyls (extremely toxic volatile compounds), and amplify the toxicity of PM2.5 microparticles.
Third — the thermal structure of the fire. Real-world combustion (unlike laboratory combustion) always contains low-temperature zones and a cooled smoke plume. Those are precisely the conditions that favour the synthesis of phosgene, acrolein, and hydrogen cyanide.
Hence three parallel hazard streams — acute toxicological, slow ecological, and systemic logistical. We address them in turn.
The Toxic Profile of the Fire: Four Floors of Lethal Hazard
Killer gases: minutes-scale lethality
The first contour comprises substances that kill almost instantly.
Hydrogen sulphide (H₂S). Forms during thermal decomposition of sulphur-containing compounds. The mechanism is simple and merciless: it blocks cytochrome oxidase, halting cellular respiration. Death follows in anything from instantaneous to ten minutes. The principal treachery: at lethal concentrations, H₂S stops smelling. The olfactory nerve is paralysed, the human being loses their only natural hazard sensor, and dies without warning.
Hydrogen cyanide (HCN). A combustion product of nitrogen-containing organics. Same mechanism as H₂S but stronger — 5–15 minutes to death.
Carbon monoxide (CO). The classic of incomplete combustion. Binds haemoglobin, induces hypoxia. Slower — hours — but effective.
Delayed killers: working over 24–72 hours
This floor is the most insidious. A person evacuates, feels unwell but alive, returns home — and dies 24–48 hours later.
Acrolein. A product of incomplete oxidation of unsaturated hydrocarbons. Causes uncontrolled tearing, lung burn, haemorrhagic oedema. The first-minute effect is to deprive a person of the ability to see and evacuate.
Phosgene (COCl₂). Forms in the cool zones of the flame in the presence of a chlorine source — sea salt, PVC fragments, chlorinated additives. Hydrolyses in the alveoli into HCl; pulmonary surfactant is destroyed. “Dry” pulmonary oedema appears 24–48 hours later. At the moment of poisoning there is almost no cough — a false sense of well-being — followed by acute respiratory failure.
SO₂ → H₂SO₄. A product of sulphur oxidation in oxygen-rich zones. In the moist airways, sulphuric acid is generated in situ: chemical burn, bronchospasm, asthma exacerbation, alveolar damage. Action is immediate.
Nickel carbonyl [Ni(CO)₄]. Forms from nickel catalysts and steel structures in the presence of CO (Ni + 4CO → Ni(CO)₄). One of the most toxic compounds known to toxicology. Lethal cumulative dose is around 30 mg. Pulmonary and cerebral oedema 36 hours after exposure.
A conclusion that virtually all response protocols ignore: an evacuee in the first hours is not safe. Medical observation must continue for at least 72 hours, and for risk groups — up to two weeks.
Long-lived toxins: a legacy across generations
This is the floor where the “accident” ends and the “demography” begins.
Dioxins (PCDDs/PCDFs). Form in the cool zones of the smoke plume from combustion products in the presence of chlorine (sea salt, PVC, chlorinated impurities) and catalysts (copper, iron). IARC Group 1 carcinogen, immune suppressor (“chemical AIDS”), endocrine disruptor. Effects span chloracne, teratogenesis, endometriosis. Half-life in the human body — 7–11 years; in soil — decades. A sour-crude fire in a port zone is an ideal dioxin generator.
PAHs (benzo(a)pyrene and its family). Products of incomplete combustion. IARC Group 1 carcinogen. Settle on soils, migrate into water bodies, accumulate in fish. Persistence — months to years in the body, years in the environment.
Vanadium and nickel. Native components of heavy sour crude, concentrated in combustion residues and slag. Cause lung cancer, neurotoxicity, persistent allergies. In soil — years to decades.
Toxic soot: why PM2.5 is not just “dust”
One of the most dangerous popular illusions is the picture of soot as merely “dirty dust.” In reality, fine (PM2.5) and ultrafine (PM0.1) particles are not “particles” but agglomerates — complex assemblies in which the carbon scaffold is merely a carrier.
On the surfaces of such particles are fixed:
- Heavy-metal compounds — vanadium, nickel, lead, arsenic, mercury, cadmium.
- Persistent organic pollutants — PAHs, dioxins, furans.
- Strong-acid residues — sulphuric, nitric, organic acids.
- Free radicals and reactive oxygen species — initiators of oxidative cellular damage.
The points of entry are mucous membranes: eyes, nasopharynx, bronchi, alveoli. The particular danger of PM0.1 is that ultrafine particles traverse the alveolar barrier and enter the bloodstream directly. From there — heart, brain, liver, kidneys, placenta.
Each such inhalation is therefore a courier delivery of carcinogens, neurotoxins, and heavy metals straight into the blood, bypassing nearly all defensive barriers. This is a fundamentally different mechanism from that of classical smoke, on which the older civil-defence protocols were built.
Documented consequences of prolonged exposure to toxic PM:
- Respiratory: COPD, asthma, interstitial fibrosis, lung cancer.
- Cardiovascular: accelerated atherosclerosis, myocardial infarction, ischaemic stroke, arrhythmias.
- Nervous system: cognitive decline, accelerated dementia via systemic neuroinflammation, depression.
- Reproductive: reduced fertility, low birth weight, preterm birth.
- Metabolic: insulin resistance, exacerbation of diabetes.
PM is not a “byproduct” of the fire. It is the principal transport system delivering all the other toxins straight into the blood. That is why a dust mask alone here is no defence — it is fatal self-deception.
Quantitative reference: the order-of-magnitude framework
To grasp the orders of magnitude — the key thresholds in ppm and mg/m³. The following compares occupational standards, IDLH values (NIOSH), and lethal concentrations; it is not a single legal regime but an orientation.
| Substance | Sensory threshold | Workplace exposure limit | IDLH / lethal |
| H₂S | Smell from 0.008 ppm | 10 ppm | Olfactory paralysis 100–150 ppm; death 700+ ppm |
| SO₂ | Irritation 1–5 ppm | 2 ppm | IDLH 100 ppm; lethal 400–500 ppm in 30 min |
| HCN | Bitter almonds ~1 ppm | 4.7 ppm | IDLH 50 ppm; death 270 ppm immediate |
| CO | Odourless | 25 ppm | IDLH 1200 ppm; death 1600 ppm in 2 h |
| Phosgene | Fresh hay 0.4 ppm | 0.1 ppm | IDLH 2 ppm; lethal 50 ppm in short exposure |
| Acrolein | Irritation 0.1 ppm | 0.1 ppm | IDLH 2 ppm |
| Ni(CO)₄ | No reliable odour | 0.001 ppm | IDLH 2 ppm; death ~30 mg cumulative |
| PM2.5 | Imperceptible | WHO annual mean 5 μg/m³ | In a fire plume — thousands of μg/m³ |
| Dioxins (TEQ) | Imperceptible | TWI (EFSA 2018): 2 pg/kg bw per week; 2025 EFSA draft — reduction to 0.6 pg | Cumulative; effects manifest over years |
Three takeaways from the table:
- For phosgene and nickel carbonyl, lethal concentrations lie below 2 ppm — a level the human body cannot detect before symptoms develop. No filter mask without a specialised cartridge offers protection in principle.
- H₂S has an odour threshold roughly ten thousand times lower than its lethal concentration — but at the lethal level the smell disappears. The nose cannot be trusted as a hazard sensor.
- Dioxins act in picograms per kilogram of body weight. Chronic exposure does not require being inside the plume — eating fish, milk, or vegetables from the region a year after the fire is sufficient.
A Cascading Injury System: Four Levels with a Reinforcing Loop
The previous section sorted the toxins by time of action. The same information, re-read by mechanism of harm, yields not four parallel blows but a four-level system with direct amplification between levels. This is not a sum of effects; it is a feedback cascade in which each preceding level opens the door to the next.
Level 1 — instant shutdown (neurotoxins: H₂S, HCN, CO). Cytochrome-oxidase blockade halts cellular respiration. The person dies within minutes — before they can feel a burn or shortness of breath, that is, before subsequent levels develop. Where Level 1 does not kill, it leaves survivors with CNS damage that reduces respiratory-muscle tone and cough efficiency — directly weakening the first barrier ahead of Level 2.
Level 2 — destruction of the pulmonary barrier (acrolein, phosgene, SO₂, carbonyls). Chemical burn and oedema. Phosgene hydrolysis in the alveoli destroys surfactant; oxygen-dependent particle clearance falls. This directly amplifies Level 3: the same lungs now receive the same PM2.5 doses, but with their clearance system disabled. The dose effect grows multiplicatively, not arithmetically.
Level 3 — systemic delivery into the blood (PM2.5/PM0.1). Ultrafine agglomerates carrying adsorbed metals, PAHs, and dioxins cross the alveolar barrier into the systemic circulation: systemic inflammation, endothelial dysfunction, thrombosis within days. In parallel, PM becomes the carrier for Level 4 — it is on these particles that dioxins are delivered to fat depots, the placenta, and the brain. Without Level 3, Level 4 does not unfold so quickly or so systemically.
Level 4 — long-term immune-endocrine remodelling (dioxins). Accumulating in adipose tissue over years, dioxins disrupt immunity and endocrine regulation. Here the loop closes: an immunosuppressed organism is far more sensitive to any subsequent toxic stress — including PM-driven inflammation. Each new exposure (a new fire, background pollution, a seasonal infection) lands on ground prepared by the previous one.
Key analytical conclusion. These are not four separate effects to be added together with the advice “treat each.” It is a self-amplifying system: Level 2 opens the path to Level 3, Level 3 delivers Level 4, and Level 4 makes the body susceptible to renewed Levels 2–3. Civilian “fire-response” protocols fail precisely because they assume one mechanism of harm rather than a feedback cascade. That is also why medical monitoring must be multi-year, not one-off.
The model as a forecasting tool
The cascade framework is needed not for description but for forecasting. Given the type of fire, the meteorological conditions, and the fuel composition, one can determine in advance which of the four levels will dominate — and prioritise evacuation, medical response, and ecological monitoring accordingly.
- Level 1 dominant (H₂S, HCN, CO) — high acute mortality within 0–10 km on the leeward side; the long tail is comparatively small. Priority: rapid evacuation and recovery operations, not extensive medical surveillance.
- Levels 2+3 dominant (acrolein, phosgene, SO₂ + PM) — peak load on the healthcare system in the 24–72-hour window: delayed pulmonary oedema, heart attacks, strokes. Priority: deploy pulmonology and cardiology reserves, conduct 72-hour monitoring of evacuees.
- Levels 3+4 dominant (PM as a carrier of dioxins, ground deposition) — long-term demographic effect: oncology, immunodeficiency, teratogenesis at 5–10–20 years. Priority: multi-year monitoring of food chains and birth outcomes, closure of local water and food sources.
The practical upshot: before the plume reaches the city, the meteorological forecast and the characteristics of the burning facility allow one to determine which scenario is unfolding, and to mobilise the right resources rather than spend them on the wrong response.
Limits of the model
Honest analysis requires stating where the model ceases to work or under-estimates:
- Strong wind (>50 km/h). The cascade is “stretched” over hundreds of kilometres: local concentrations fall, but the affected area grows. The model needs spatial scaling — the 0–10 km zone is no longer critical, while Levels 3–4 gain weight in distant territories.
- Absence of chlorine sources (inland facilities far from the sea, with no PVC infrastructure nearby). Dioxin and phosgene synthesis falls sharply — Level 4 is weakened, Level 2 partially as well. Risk remains, but the demographic tail is smaller.
- Rapid, high-quality firefighting (within the first 2–4 hours). Levels 2–3 may not reach critical values — phosgene and PM lack time to accumulate to dangerous concentrations. In Russian conditions this is a rare scenario, but for cross-jurisdictional comparison it must be allowed for.
- Effect of repeated fires in the same area. The model describes a single cycle. If fires recur at intervals of weeks or months (which matches the Russian pattern of strikes against refineries), the effect does not add — it multiplies through the Level-4 closing loop: each subsequent fire lands on an already immunosuppressed population. This requires a separate model overlay and separate data.
The model is not an absolute but a working instrument. Its strength lies in the transparency of its limits, not in a claim of universality.
A Sharp Comparison: Ordinary Fire vs Sour-Crude Fire
| Parameter | Ordinary fire | Sour-crude fire |
| Principal cause of death | CO + smoke | Neurotoxins + lung burn + delayed oedema |
| Immediate threat | Soot, heat, CO | H₂S (minutes), acrolein (blindness) |
| Delayed mortality | Rare | Routine (phosgene, carbonyls) |
| Chronic consequences | COPD, rarely cancer | Cancer, immunodeficiency, birth defects, endocrine disorders |
| Ecosystem recovery | Years | Decades — never (dioxins) |
| Respiratory protection | FFP2/FFP3 works | Useless — supplied-air respirators required |
Ecology: Acid, Soil, Food, Climate
The “black rain”
SO₂ + H₂O → H₂SO₄. An oily acid rain scorches foliage, acidifies soils and water bodies, and destroys soil microbiota. This is no metaphor — it is what residents along the Black Sea coast have already documented after fires at the Tuapse terminal: an oily film on cars, leaves, and laundry; scorched patches on tree foliage; fish kill in the coastal strip.
Contamination across decades
Soil. Petroleum crust + heavy metals + dioxins = either sterility or transformation into a toxic substrate. The only proper remediation is removal of the upper layer and disposal at a special-purpose landfill. In Russian conditions this is a fantasy: there are no suitable landfills, no political will, and no independent monitoring.
Water. PAHs, metals, and dioxins migrate into groundwater. Drinking wells must be closed for years. Maritime ports are a separate story: contamination of coastal waters by PAHs and metals is a long-term blow to fishing and tourism — that is, to the very “peaceful” industries that the Kremlin likes to use as cover for facilities of military significance.
Bioaccumulation: danger via the dinner plate
Dioxins and PAHs accumulate:
- in fish (concentration factors up to 10,000× background);
- in milk and animal fat;
- in vegetables grown on contaminated fields.
Practical implication: local food from regions of large-scale fires becomes dangerous for generations. This is not an emotional claim; it is confirmed by data from Alaska, Kuwait, and Seveso.
Ecosystem degradation
Acidification → die-off of amphibians, molluscs, sensitive plants. The biocoenosis is replaced by tolerant weeds and fungi. Full recovery — 50+ years.
A climatological footprint: a local accident with planetary consequences
A large-scale oil fire is not just a regional story but a global one. It leaves an entirely measurable footprint on the planet’s atmospheric and climatic processes.
- CO₂ and methane emissions. Hundreds of thousands of tonnes from a single tank farm — comparable to the daily emissions of a small country.
- Soot on glaciers and snow. Dark particles transported through the atmosphere settle on high-latitude snowpack and glaciers, lower the albedo, and accelerate melting. For the Arctic this is a direct degradation factor; Russian fires, via atmospheric transport, contribute directly.
- Sulphur and nitrogen loading of the atmosphere — acidification of precipitation thousands of kilometres from the source, regardless of borders.
- Aerosol plumes influence cloud and precipitation formation and local atmospheric circulation — and therefore agricultural yields in regions that are quite distant.
Smoke from Tuapse or Ryazan is not only regional toxicology, it is also a small but additional weight on the scales of global climate shifts. One fire — almost nothing; dozens of facilities in a state of continuous smouldering — already a meaningful factor.
A Practical Block: What to Do and What Not to Do
❌ What does NOT work
- FFP2/FFP3 and cotton-gauze masks. They do not retain H₂S, HCN, phosgene, acrolein, dioxins, or carbonyls. Only dust and a little soot. A mask under a cloud of hydrogen sulphide is psychological self-deception, nothing more.
- Sheltering in basements and lower floors. H₂S, SO₂, and carbonyls are heavier than air and creep along the ground. An unventilated basement without sealing is a death trap.
- Waiting for it to “pass on its own.” Many toxins act with a delay. Symptoms — at 24–48 hours. Feeling fine now guarantees nothing.
✅ What works
- Evacuation. Immediate, perpendicular to the wind, at least 10–15 km. Up to 30 km if the wind shifts.
- Supplied-air respiratory protection. Self-contained breathing apparatus (SCBA). Filter masks are no substitute.
- Sealing the premises (if evacuation is impossible): tape windows, switch off intake ventilation, block doors with damp cloth.
- Water and food — only from sources known to be clean. Local wells — off limits for months.
- After return — do not touch the oily fallout without gloves and protection. Soil and water testing for dioxins, metals, and PAHs is not “just in case” but mandatory.
?⚕️ Medical monitoring (critical)
Priority — the high-vulnerability groups (children, pregnant women, the elderly, the chronically ill). For them, examination is not “desirable” but mandatory and early.
Minimum panel for residents of the affected zone:
- Hepatic function (ALT, AST, GGT).
- Renal function (creatinine, urea).
- Complete blood count (leukocytes, platelets).
- Immune status (T cells, immunoglobulins).
- Tumour markers — at 6–12 months and annually thereafter.
- Pregnant women — prenatal screening for malformations.
- Chronic patients — therapy adjustments anticipating exacerbations (bronchodilators, anticoagulants, etc.).
A Real-World Scenario: What Happened in Tuapse, 16–24 April
To strip the analysis of abstraction, the framework set out above is now applied to a concrete case — the series of fires at the Tuapse oil terminal and refinery following the strikes of 16 and 20 April 2026. The scenario is reconstructed not from a hypothetical wind but from the actual meteorological conditions of that week.
What the forecast said and what the facts confirmed (72 hours from the second strike):
- 20–22 April — steady wind from the SSW, 30–50 km/h.
- Morning of 24 April — heavy rain: 22 mm by morning, 41 mm cumulatively over three days.
- Humidity 80–90%, temperature 8–10 °C, low freezing level (~1100 m); a nocturnal temperature inversion was likely.
- Wind shifted to W and NW only from 26–27 April.
Where the plume went. An SSW wind meant the plume was carried to the NNE — inland, not out to sea. Along its axis lay the densely populated, agricultural part of Krasnodar Krai and Adygea:
- 0–15 km — Tuapse itself and the Tuapse river valley: acute zone, mandatory evacuation of the leeward side. This is precisely where the operational headquarters forbade opening windows, and where Rospotrebnadzor recorded benzene and xylene exceeding maximum permissible levels by a factor of two to three.
- 50–70 km — Goryachy Klyuch, Apsheronsk, Khadyzhensk: high-exposure zone, reached by the same smog trail that arrived in Sochi on 22 April.
- 100–150 km — outskirts of Krasnodar, Belorechensk, the exit onto the Kuban plains: medium exposure with deposition of persistent toxins on soil.
- 200+ km — northern Krasnodar Krai and Rostov Oblast: zone of slow PAH, metal, and dioxin transport.
What the rain did on 24 April. This was not atmospheric cleansing. It was a literal black acid rain at the start of the growing season — falling on the fields of Adygea and central Krasnodar Krai, in the phase when the soil actively absorbs moisture and winter wheat is at the tillering stage. Dioxins, PAHs, and heavy metals settled on arable land and pasture, opening a path into the food chains (milk, meat, grain) of one of Russia’s principal agricultural regions. The oily precipitation with black particles that Tuapse residents had already documented as “oil rain” is a direct illustration of this mechanism.
Net effect over 72 hours:
- Acute zone — the coastal Tuapse valley. On this meteorological window, the plume did not reach Sochi or Lazarevskoye (the southern coast).
- Medium zone — the industrial-agricultural corridor Krasnodar–Apsheronsk–Khadyzhensk: potentially hundreds of thousands of people exposed to PM2.5, SO₂, and PAHs.
- Long tail — the Kuban basin, agricultural soils at the start of vegetation: accumulation of persistent toxins in Russia’s food supply.
- Climatological tail — aerosol transport across the foothills of the North Caucasus into central Russia and toward the Caspian.
This scenario rests on a real weather window that closed within 3–4 days. A different wind configuration would have produced a different geometry of catastrophe, but the logic remains: acute injury at tens of kilometres, medium-term injury at hundreds, persistent toxins at thousands. That logic must be built into the response protocol in advance — not learned from the news.
Conclusion: a Different Class of Catastrophe — a Different Protocol
A sour-crude fire is not a local emergency. It is a long-term toxic scenario whose consequences extend beyond the ignition zone and surface over years:
- oncological morbidity,
- immunodeficiencies (“chemical AIDS”),
- reproductive disorders and birth defects,
- ecosystem degradation across generations.
The protective tools appropriate to an ordinary fire are here fatally dangerous. An FFP2 mask under a cloud of hydrogen sulphide is not protection; it is a ticket to the morgue with the illusion of dignity.
The principal systemic conclusion — for civil protection, for medicine, and for ecological monitoring alike: sour-crude fires require a dedicated response protocol — evacuation, medical, ecological — at the level today reserved for nuclear-plant accidents. Using standard “fire” protocols here means additional casualties not from flame, but from chemistry.
The Russian Oil Industry Is Not a Civilian Sector
So far we have been speaking about chemistry, medicine, ecology, and practical defence — that is, about how to respond to a fire. There remains a question of a different order: why are there so many of these fires, and why is this what burns? Here we must move from toxicology to geopolitics — and it turns out that geopolitics is tightly coupled to toxicology.
Russian oil refining is not about petrol for private cars. It is a node in the network of the military-industrial complex. A modern refinery is not a one-product factory but a producer of dozens of fractions and intermediates — many of which have direct or dual-use military applications:
- Fuel for tanks, IFVs, and aircraft — diesel, aviation kerosene (TS-1, RT). Without it neither a Su-34 nor an air-launched Kalibr leaves the ground.
- Rocket-fuel components. Petrochemical derivatives feed the synthesis of UDMH (heptyl), kerosenes of the “Sintin” class, and other components of liquid rocket propellants.
- Explosive precursors. Toluene → TNT. Aromatics — feedstock for nitration. Butadiene, styrene — components of solid rocket propellants via synthetic rubbers.
- Lubricants and additives for military equipment, without which a tank column becomes scrap metal within a week of forced marching.
The Ryazan and Volgograd refineries, the Novoshakhtinsk plant, and the Novorossiysk and Tuapse oil terminals are not merely “civilian enterprises.” They are links in a logistics chain that, every morning, fuels the very military machine that kills people in Ukraine. Disabling one of these links means hundreds of tonnes of diesel less at the front per day, and dozens of bomber sorties less per week.
That is why the framing “clean ecology vs dirty industry” does not work here. Each destroyed distillation column is not only a column of smoke over Tuapse — it is a batch of aviation kerosene that will not now be produced, with which a bomber will not be fuelled for a strike on Kharkiv, Zaporizhzhia, or Odesa.
The question is not whether Ukraine has the right to reduce aviation-kerosene supplies to the army that is attacking it. The question is whether a country against which a war of annihilation is being waged can be made to choose between its own survival and the ecological sterility of the aggressor’s territory. International humanitarian law gives an unambiguous answer: priority lies with those under attack, not with those whose economy fuels the attack. Anything else is either moral blindness, or a symmetrical manipulation by those who started the war and now seek a way to prolong it with impunity.
The Geneva Framework: Who Is Violating Whom
Modern international humanitarian law — in particular Additional Protocol I of 1977 to the Geneva Conventions of 1949 — sets out several key prohibitions:
- The civilian population may not be the object of attack (Art. 51).
- Methods and means of warfare that may cause widespread, long-term, and severe damage to the natural environment are prohibited (Arts. 35 and 55).
- Military objectives — those that “by their nature, location, purpose, or use, make an effective contribution to military action” (Art. 52) — are lawful targets.
Let us invert the usual frame: instead of asking “what is permitted to Ukraine,” let us ask “what is Russia actually doing.”
On Art. 51 (prohibition of attacks on civilians). The Russian army systematically attacks residential districts of Kharkiv, Dnipro, Odesa, Zaporizhzhia, Kherson, Sumy, Chernihiv, and Kyiv. Shahed drones and Kalibr cruise missiles, launched on fuel produced at the very refineries under discussion here, deliberately strike civilians — documented by the UN Human Rights Monitoring Mission, BBC, Reuters, and AP.
On Arts. 35 and 55 (prohibition of disproportionate environmental harm). The destruction of the Kakhovka Hydroelectric Power Plant in June 2023 — the largest ecological catastrophe in 21st-century Europe, with hundreds of thousands of tonnes of petroleum products, fertilisers, and heavy metals carried into the Black Sea. The seizure of the Zaporizhzhia Nuclear Power Plant — a chronic radiological blackmail of the entire continent. The targeted shelling of Ukrainian oil depots and storage facilities (Kremenchuk, Vasylkiv, Lysychansk, Odesa) — each instance accompanied by large-scale toxin releases into the waters of the Dnipro and the Black Sea.
On Art. 52 (the definition of military objectives). Russian refineries, oil depots, and port terminals serving military logistics are — under any good-faith reading of IHL — dual-use objects, a substantial share of which fall within the definition of military objectives. Strikes on them are not violations of the Geneva Conventions in the sense Russian propaganda seeks to imply.
In other words: the norms of the Geneva Conventions are indeed being violated — but it is the side that started the war, not the side defending itself, that does so systematically, on a massive scale, and deliberately. Any attempt to equate strikes on Russian military-industrial infrastructure with attacks on Ukrainian cities is not a legal argument; it is a propagandistic inversion.
At the same time, there remains an open question to which Ukrainian and international expert communities must respond honestly: the long-term ecological footprint of refinery fires. Dioxins, heavy metals, and PAHs do not respect borders — air masses, the Black Sea, and river basins transport them across thousands of kilometres. A monitoring and response protocol is therefore needed both in occupied territories and in neighbouring states, and inside Ukraine itself — to document possible transboundary contamination and to provide a scientifically grounded response to it.
And finally. Every column of black smoke over a Russian oil terminal is two parallel storylines. The first is about toxicology and risks for people hundreds of kilometres from the epicentre. The second is about a logistics chain in which the petrol pump at a Krasnodar filling station and the shell depot in occupied Zaporizhzhia oblast are links of one network. To read the two storylines apart is to understand neither.
Author — Vladislav Balinskyy, head of the Odesa branch of the National Ecological Centre of Ukraine (NECU), head of the “Green Leaf” NGO, chemist and biologist.
Annex: A Chronological Register of Accidents at Russian Refineries and Energy-Sector Facilities, 2024–2026
(As of 20 April 2026; including incidents resulting from Ukrainian strikes on Russian oil infrastructure.)
2024
- 25 January — UAV strike on the Tuapse refinery; fire on the vacuum unit.
- 28 January — strike on the oil depot in Kotelnich (Kirov Oblast); fire.
- 3 February — fire at the Volgograd refinery (AVT-5 unit).
- 9 February — fire at the Ilsky refinery (AVT-6 unit).
- 13 March — strike on the Ryazan refinery complex; AT-6 and AVT-4 units damaged.
- 13 March — strike on the Novoshakhtinsk refinery; production halted.
- 16 March — fire at the Syzran refinery (AVT-6 unit).
- 23 March — strike on the Kuibyshev refinery; fires on AVT-4 and AVT-5 units.
- 2 April — fire at TANECO (AVT-7 unit).
- 1 May — fire at the Ryazan refinery complex (AVT-3 unit).
- 12 May — strike on the Volgograd refinery; fire on AVT-1 unit.
- 17 May — fire at the Tuapse refinery (propane-butane rectification section).
- 19 May — strike on the Slavyansk refinery; production halted.
- 6 June — strike on the Novoshakhtinsk refinery; both AVT units halted.
- 22 July — fire at the Tuapse refinery after UAV-debris fall.
- 12 August — fire at the Omsk refinery (AVT unit).
- 26 August — second fire at the Omsk refinery; AVT unit halted.
- 28 August — strike on the oil depot in Kamensky District, Rostov Oblast.
- 28 August — strike on the oil depot in Kotelnich (Kirov Oblast).
- 1 September — fire at the Moscow refinery (Euro+ complex).
- 10 September — accident at the Yaroslavl refinery; catalytic-cracking unit halted.
2025
- 4 October and 14 September — fires at Kirishinefteorgsintez (KINEF).
- 24 and 18 September — strikes on Gazprom Neftekhim Salavat.
- 12 December and 1 October — fires at Yaroslavnefteorgsintez (YANOS).
- 15 November, 23 October, 5 September, 2 August, 24 February — series of strikes on the Ryazan refinery complex.
- 20 September and 2 August — strikes on the Novokuibyshevsk refinery.
- 28 August — strike on the Kuibyshev refinery.
- 5 December, 15 August, 4 March, 19 February — strikes on the Syzran refinery.
- 15 October — strike on Ufaneftekhim.
- 3 March — fire at the Ufa refinery.
- 11 and 14 November, 10 August, 11 February — strikes on the Saratov refinery.
- 3 November and 6 October — strikes on the Tuapse refinery.
2026
- 11 February — strike on the Volgograd refinery; production halted.
- 12 February — fire at the Ukhta refinery (AVT-1 unit).
- 17 February — fire at the Ilsky refinery.
- 17 and 15 February, 21 January — fires at the port of Taman.
- 13 January — strike on two CPC tankers.
- 14 and 21 January — fires at the Afipsky refinery from UAV-debris fall.
- 21 March — strike on the Saratov refinery (AVT-6 unit).
- 23 February — strike on the Kaleykino oil-pumping station (Transneft).
- 2 March — fire at the Novorossiysk port terminal.
- 12 March — fire at the oil depot in Tikhoretsky District.
- 22–31 March — series of strikes on the ports of Primorsk and Ust-Luga.
- 25 March — fire at the Novatek complex in Ust-Luga; export of petroleum products halted.
- 26 March — strike on Kirishinefteorgsintez (KINEF); fire, partial shutdown.
- 2 April — fire at the Novo-Ufa refinery (AVT-5 unit).
- 5 April — UAV strike on the Nizhegorodnefteorgsintez (NORSI) refinery; fire and production halt.
- 6 April — strike on the port of Novorossiysk (Sheskharis terminal).
- 6 April — strike on Caspian Pipeline Consortium (CPC) facilities.
- 16 and 20 April — strikes on the seaport and oil refinery in Tuapse.
40 YEARS OF CHORNOBYL: FROM SOVIET HUBRIS TO RUSSIAN NUCLEAR TERRORISM
Ahead of the 40th anniversary of the catastrophe, Zeleny List journalist Hlib Yehorov travelled to the Chornobyl Exclusion Zone on 22–23 April. There he recorded exclusive conversations with two specialists who deal with the consequences of the worst technogenic disaster in human history every working day — Serhii Bokov, shift supervisor at the Shelter Object and the New Safe Confinement, and Nadiia Mudryk-Mochalova, head of the press service of the State Agency for the Management of the Exclusion Zone. This piece is based on those conversations and our reporting on the ground.
“The Third Angel” sculpture in the Chornobyl Zone — a symbol of the biblical allegory of the catastrophe. Photo: Hlib Yehorov for Zeleny List
Forty years ago, on 26 April 1986, humanity suffered the worst technogenic catastrophe in its history. Yet looking back across these four decades today, what we see is not merely an accident — we see an unbroken line of crime, running from Soviet arrogance through post-Soviet silence to the deliberate Russian nuclear terrorism of 2025.
Soviet DNA: hubris, lies, pits in the forest
Chornobyl did not begin with the explosion of a reactor. It began with a system in which ideological ambition always outweighed human life. When, in the small hours of 26 April, that ingrained hubris finally produced catastrophe, the communist leadership did exactly what the Soviet system had always done: it began to lie. While the people of Prypiat marched in May Day parades and children played in courtyards under radioactive rain, in Moscow the discussion was not how to save the population, but how to keep the truth from the world.
The first firefighters fought a graphite blaze without protection because no one told them what they were dealing with. And when the threat of a second, even more devastating explosion emerged — from molten nuclear fuel meeting the water in the bubbler pools beneath the reactor — three men went down to deal with it: Oleksiy Ananenko, an engineer who knew the plant’s underground communications intimately, Valeriy Bezpalov, a senior engineer of the turbine workshop, and Borys Baranov, a shift supervisor. In chemical-protection suits and respirators, torches in hand, they made their way through corridors flooded with radioactive water on the lower level and manually opened the valves to drain the water from beneath the reactor. Behind them came roughly 600,000 liquidators from across the Soviet Union. Hostages of the information blockade, sent in without proper protection, without truthful instructions, without any real understanding of what they were being thrown into.
“To Those Who Saved the World” memorial in Chornobyl — a monument to the firefighter-liquidators. Photo: Hlib Yehorov for Zeleny List
No less telling is the way that same system “cleaned up” the consequences. As Nadiia Mudryk-Mochalova told our journalist, in the panic of 1986 contaminated equipment, soil and entire stretches of forest — anything that emitted radiation — were simply scraped into ordinary trenches across the Zone. No waterproofing. No methodology. No standards of any kind. Just pits in the ground, covered over with earth, in which thousands of tonnes of nuclear-hazardous material were buried. Today these Soviet “burial grounds” are poisoning the groundwater of Polissia, and only now, with European Union support, is Ukraine forced to dig them up and move the waste into modern, safe storage. Cleaning up after those who poisoned the land and ran away.
Hotel Polissia in Prypiat: in the photograph held in hand — the way it stood before 26 April 1986; in the background — what it has become. Photo: Hlib Yehorov for Zeleny List
How the world covered Chornobyl: the Arch over catastrophe
After the collapse of the USSR, Ukraine was left alone with a radioactive ruin in the depths of an economic crisis. Moscow, which had caused the disaster, simply washed its hands. The hand that was extended came from the West: in 1995 the Ottawa Memorandum was signed, under which Ukraine committed to closing the Chornobyl plant, while the G7 and the European Union committed to financing its safe decommissioning and the construction of a new and reliable confinement. In 1997, under the auspices of the European Bank for Reconstruction and Development, the Shelter Fund was established. Twenty-five countries joined it: alongside the G7, these included the Netherlands, Norway, Sweden, Denmark, Switzerland, Poland, Kuwait and others.
Working materials in the administrative building of the Chornobyl NPP: an aerial view of the New Safe Confinement over the fourth power unit. Photo: Hlib Yehorov for Zeleny List
The result of those international efforts is a structure that engineers describe as one of the most complex ever built. In 2016, a New Safe Confinement (NSC) was rolled into place over the destroyed fourth power unit — an arch more than 100 metres tall, valued at over 2 billion euros. The principal contractor was the French consortium Novarka, formed specifically for the project: a partnership between two global construction giants, Vinci Construction Grands Projets and Bouygues Travaux Publics. Hundreds of subcontractors from more than 30 countries worked on it.
The NSC is not simply a lid over the old sarcophagus. As Serhii Bokov explained to our journalist, the structure consists of an inner and outer cladding separated by an annular gap. A specialised ventilation system maintains controlled humidity, slowing corrosion. A pressure differential between the gap and the main volume creates an additional barrier against the release of radiation. Designed lifespan: 100 years.

Serhii Bokov, shift supervisor of the Shelter Object and the New Safe Confinement. Photo: Hlib Yehorov for Zeleny List
The inner cladding of the New Safe Confinement. Between this and the outer cladding lies the annular gap with controlled humidity and pressure differential. Photo: Hlib Yehorov for Zeleny List
During that century, Bokov stresses, the NSC was meant to allow the safe dismantling of the old Soviet “sarcophagus” — a structure built for a 20-year lifespan that has long since exhausted its design life and effectively ceased performing its function.
The old Soviet “sarcophagus” of 1986, now sheltered by the New Arch. It was precisely this structure the NSC was meant to allow dismantled safely. Photo: Hlib Yehorov for Zeleny List
14 February 2025: an act of nuclear terrorism, and its price
And then came the Geran-2.
On 14 February 2025, the russian federation carried out a deliberate strike with an attack drone against the roof of the NSC. As Bokov describes, the drone punched through both the outer and inner cladding and ignited the sealing membrane — a high-strength polyurethane element that is critical to the structure: it joins the movable Arch with the existing buildings of the fourth power unit, forming the barrier that keeps radioactive aerosols from escaping into the environment.
The roof of the New Safe Confinement after the russian Shahed strike of 14 February 2025. The damaged area is visible in the centre. Photo: Hlib Yehorov for Zeleny List
The same damage from a different angle — approximately 15 square metres of through-and-through destruction of both outer and inner cladding. Photo: Hlib Yehorov for Zeleny List
The fire burned for two weeks. To extinguish hidden seats of combustion inside the roof, rescuers had to cut 332 technological openings in the outer cladding. The total area of through-and-through damage came to roughly 15 square metres. The object temporarily lost its principal function: the system maintaining excess pressure in the inter-cladding space was disrupted.
Damage to the outer cladding, close-up. The track of the drone’s passage and one of the technological openings. Photo: Hlib Yehorov for Zeleny List
“That this strike did not lead to a large-scale radioactive catastrophe,” Bokov relays the assessment of the plant’s specialists, “can only be considered limitless luck.”
According to the shift supervisor, the engineering solutions for the repair are being developed by the same French companies — Bouygues and Vinci — that originally built the Arch. Because of high radiation levels and the height of more than 100 metres, much of the work will be carried out by remote-controlled robots and manipulators. The repair plan covers the replacement of damaged sections of inner and outer cladding, the complete replacement of the sealing membrane and waterproofing layer, and the restoration of the integrated automatic system for monitoring temperature and humidity. The estimated cost: 500 million euros. Through the end of 2026, temporary repairs will be carried out to restore basic confinement and partial sealing. The main phase will begin in 2028 and must be completed by the end of 2030. That is a critical deadline — beyond which, with ventilation compromised, corrosion will begin to destroy the structure irreversibly. Around 30 million euros has already been allocated for the initial works in 2026. The remainder will be raised by the EBRD from donor countries by the end of 2027.
Once again, the world is paying for a russian crime.
Storage facilities held hostage
The NSC is not the only sore point of the Exclusion Zone. As Nadiia Mudryk-Mochalova notes, two spent-nuclear-fuel storage facilities operate on the Chornobyl industrial site, with fundamentally different safety profiles.

Nadiia Mudryk-Mochalova, head of the press service of the State Agency for the Management of the Exclusion Zone. Photo: Hlib Yehorov for Zeleny List
ISF-1 is the old Soviet wet-type storage where fuel from reactors 1, 2 and 3 is kept in pools of water that require continuous active cooling. According to Mudryk-Mochalova, it was precisely during the russian occupation of the plant in 2022 that prolonged loss of power nearly produced disaster: had the water boiled off, the fuel would have overheated and a radioactive release would have followed.
A Soviet control panel at the Chornobyl NPP — the era in which safety was guaranteed by analogue instruments and human vigilance. Photo: Hlib Yehorov for Zeleny List
The fuel is now being transferred to ISF-2 — a new dry-type facility commissioned shortly before the full-scale invasion. Its construction cost the international community around 448 million euros. More than 28 countries — once again primarily the G7 and the European Commission — financed the facility through the EBRD’s Nuclear Safety Account. Unlike ISF-1, the new facility uses passive ventilation and is designed for 100 years of autonomous, safe storage.

The modern ISF-2 control centre — the new dry-type spent-fuel storage facility, built by 28 donor countries. Photo: Hlib Yehorov for Zeleny List
Nor is the russian nuclear threat confined to Chornobyl alone. The Zaporizhzhia NPP — the largest nuclear power plant in Europe — is now in its fourth year of russian military occupation, converted from a civilian object into a platform for nuclear blackmail. And every day, every night, dozens of russian missiles and drones cross the Exclusion Zone on their way from “fraternal” belarus deep into Ukraine. Each of those flights, our interlocutors emphasise, is a potential continental-scale catastrophe.
A business built on fear: the rosatom protectorate, and the habit of concealment
Here begins the most cynical chapter of this story. What for the world became a lesson, for the Kremlin became a commodity. For decades, Moscow has exploited the theme of Chornobyl on two parallel tracks. On one track — nuclear blackmail: by frightening the world with the spectre of another disaster, russia has positioned itself as a “monopolist of knowledge”, insisting that only we understand these technologies, only we know how to deal with the consequences, only we can be trusted with nuclear safety.
On the other track — the commercialisation of that fear. Having moved on to a new generation of genuinely safer Generation 3+ reactors, russia began building NPPs across the world — in Hungary, Turkey, Bangladesh, Egypt, India. But this was never simply the sale of energy infrastructure. This is a technological protectorate: contracts are structured so that only russian fuel, only russian service teams, only russian control software, only russian operator training — every component is bound exclusively to rosatom. The classic “hooking on the needle”: a country that buys a russian reactor enters a multi-decade dependence from which exit is politically and economically all but impossible. The reactor becomes a Trojan horse — an instrument of soft occupation that runs for sixty years.
And here lies the most important parallel of our day. Ukrainian strikes against russian oil-refining facilities are strikes against legitimate military targets: russia’s oil infrastructure is a dual-use industry — and often, in essence, a primarily military one. It feeds the war machine directly, producing fuel for missiles, components for explosives, and the logistics of the front. Ukraine, as the defending side, acts within the bounds of the Geneva Conventions, and strikes against these objects are today among the most effective means of degrading the aggressor’s military potential. The question is not the strikes themselves. The question is how the russian authorities deal with the consequences for their own population. In Tuapse, Novorossiysk, Ryazan, Samara, storage tanks burn, oil flows into the Black Sea, carcinogenic compounds vent into the air. What does the russian government do? Exactly what the Soviet government did in 1986: residents are not informed of what is actually being released, contamination data is classified, the local population lives in an information vacuum — precisely as the people of Prypiat did in the spring of 1986.
Soviet murals in an abandoned building in Prypiat — a monument to the ideology that raised generations accustomed to silence. Photo: Hlib Yehorov for Zeleny List
An abandoned gymnasium in Prypiat. The pommel horse has stood in this same spot since 27 April 1986. Photo: Hlib Yehorov for Zeleny List
More than that, russia’s bet on risk needs no war as its pretext. The catastrophe involving Volgoneft-class tankers in the Kerch Strait at the end of 2024 confirmed it: old Soviet vessels, structurally unfit for sea service, broke apart in a storm and dumped tens of thousands of tonnes of mazut into the water. More than a year later, the Kremlin still has not carried out a proper cleanup — the mazut is still washing up on the coast, birds are dying, beaches are poisoned, and local residents are scraping it up by hand. The russian oil and transport industries were an ecological time bomb long before the full-scale war — that fact was simply suppressed.
The “Lazurny” swimming pool in Prypiat. One of the most recognisable symbols of the catastrophe — it continued operating for liquidators until 1998. Photo: Hlib Yehorov for Zeleny List
Bumper cars at the amusement park in Prypiat. The park was due to open officially on 1 May 1986 — five days after the catastrophe. Photo: Hlib Yehorov for Zeleny List
The Soviet genetic code — the human being as resource, the truth as a threat to power — has not gone anywhere. It has merely changed its clothes.
Chornobyl is not over
For russia, Chornobyl was never a lesson. It was, and remains, an instrument: first, an instrument of Soviet concealment; then, an instrument of monopolistic blackmail; now, an instrument of direct nuclear terrorism. The common denominator runs through all three: indifference to human life — its own and that of others — and to international security as such.
Forty years on, the chain is unmistakable: Soviet hubris in 1986 → Soviet silencing and lawless dumping of waste → post-Soviet flight from responsibility → the conversion of Chornobyl into commodity and threat → the seizure of the Zaporizhzhia NPP → the deliberate strike on the Arch on 14 February 2025.
While russian missiles cross the Exclusion Zone, while tanks burn in Tuapse, while the mazut from the Volgonefts poisons the coast, while the groundwater of Polissia still glows beneath Soviet trenches — this is not history. This is the present.
The Ferris wheel in Prypiat’s amusement park — perhaps the most recognised symbol in the world of a catastrophe that has never stopped. Photo: Hlib Yehorov for Zeleny List
The Chornobyl catastrophe continues. And it will continue until nuclear terrorism, as an instrument of russian policy, is brought to an end.
This report from the Chornobyl Exclusion Zone was prepared by Zeleny List journalist Hlib Yehorov. Exclusive comments for this piece were provided by Serhii Serhiyovych Bokov, shift supervisor of the Shelter Object and the New Safe Confinement, and Nadiia Mudryk-Mochalova, head of the press service of the State Agency for the Management of the Exclusion Zone.
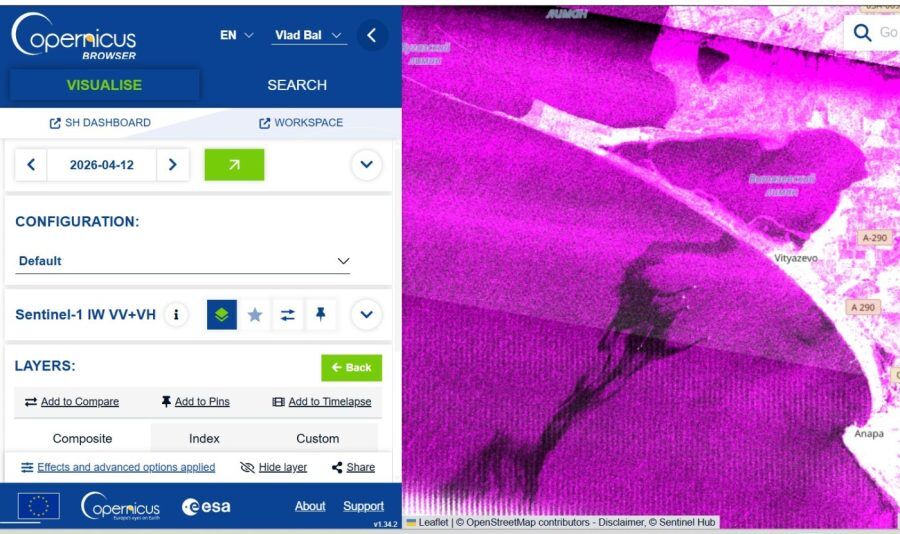
A New Level of Satellite Monitoring Strengthens Evidence of Environmental Crimes
At the “Environmental Security of the State” conference, held on April 16, 2026 at the Kyiv Aviation Institute, Vladyslav Balinskyi, head of the Green Leaf NGO and the Odesa branch of the National Ecological Centre of Ukraine, presented research results showing that satellite monitoring of the Black Sea is becoming a key tool for documenting oil pollution and building an evidence base for environmental violations.
Read More
Dniester Under an Oil Slick: How a Strike on a Hydropower Plant Triggered a Transboundary Environmental Crisis
Pollution of the Dniester after the strike on the hydropower plant became not only an environmental but also a diplomatic crisis: Moldova declared an alert, and its diplomats handed a Russian representative a sample of contaminated water. Why can even 1.5 tonnes of transformer oil have consequences lasting for decades — and is Odesa at risk?
Read More