Yearly Archive 2026

ByVladislav Balinsky

From the Kerch Strait to the Gulf of Finland: The Simulation of a Sea “Cleanup”, russia’s Diesel Deal and the Threat to the Baltic

Vladyslav Balinskyy · biologist, head of the Green Leaf NGO

On 21 August 2026, Moscow announced that it had pumped heavy fuel oil out of three sunken sections of the tankers Volgoneft-212 and Volgoneft-239. The announcement was repeated on 25 September, this time with a claim that the affected waters had been cleaned up. Then, on 9 October, donald trump announced an agreement on supplies of russian diesel fuel and a temporary easing of the relevant sanctions restrictions. These events are connected by more than their proximity on the calendar. What we are seeing is an attempt to turn an environmental disaster, whose effects remain visible from space, into a story of a “problem successfully resolved”.

I have been investigating this accident since December 2024. On satellite images acquired even after the announcements in August and September, I can still see extensive surface plumes originating near the same submerged objects. The time series available to me shows no clear break in the pattern, either during the purported final stage of the operation or afterwards. That is why I regard the campaign of announcements about a “complete cleanup” as an informational simulation of an environmental result. And the strongest argument here comes from the russian authorities’ own experience: when they genuinely pumped out fuel oil in 2025, they themselves showed exactly how it was done.

1. Two “pumping operations” — and two entirely different ways of reporting them

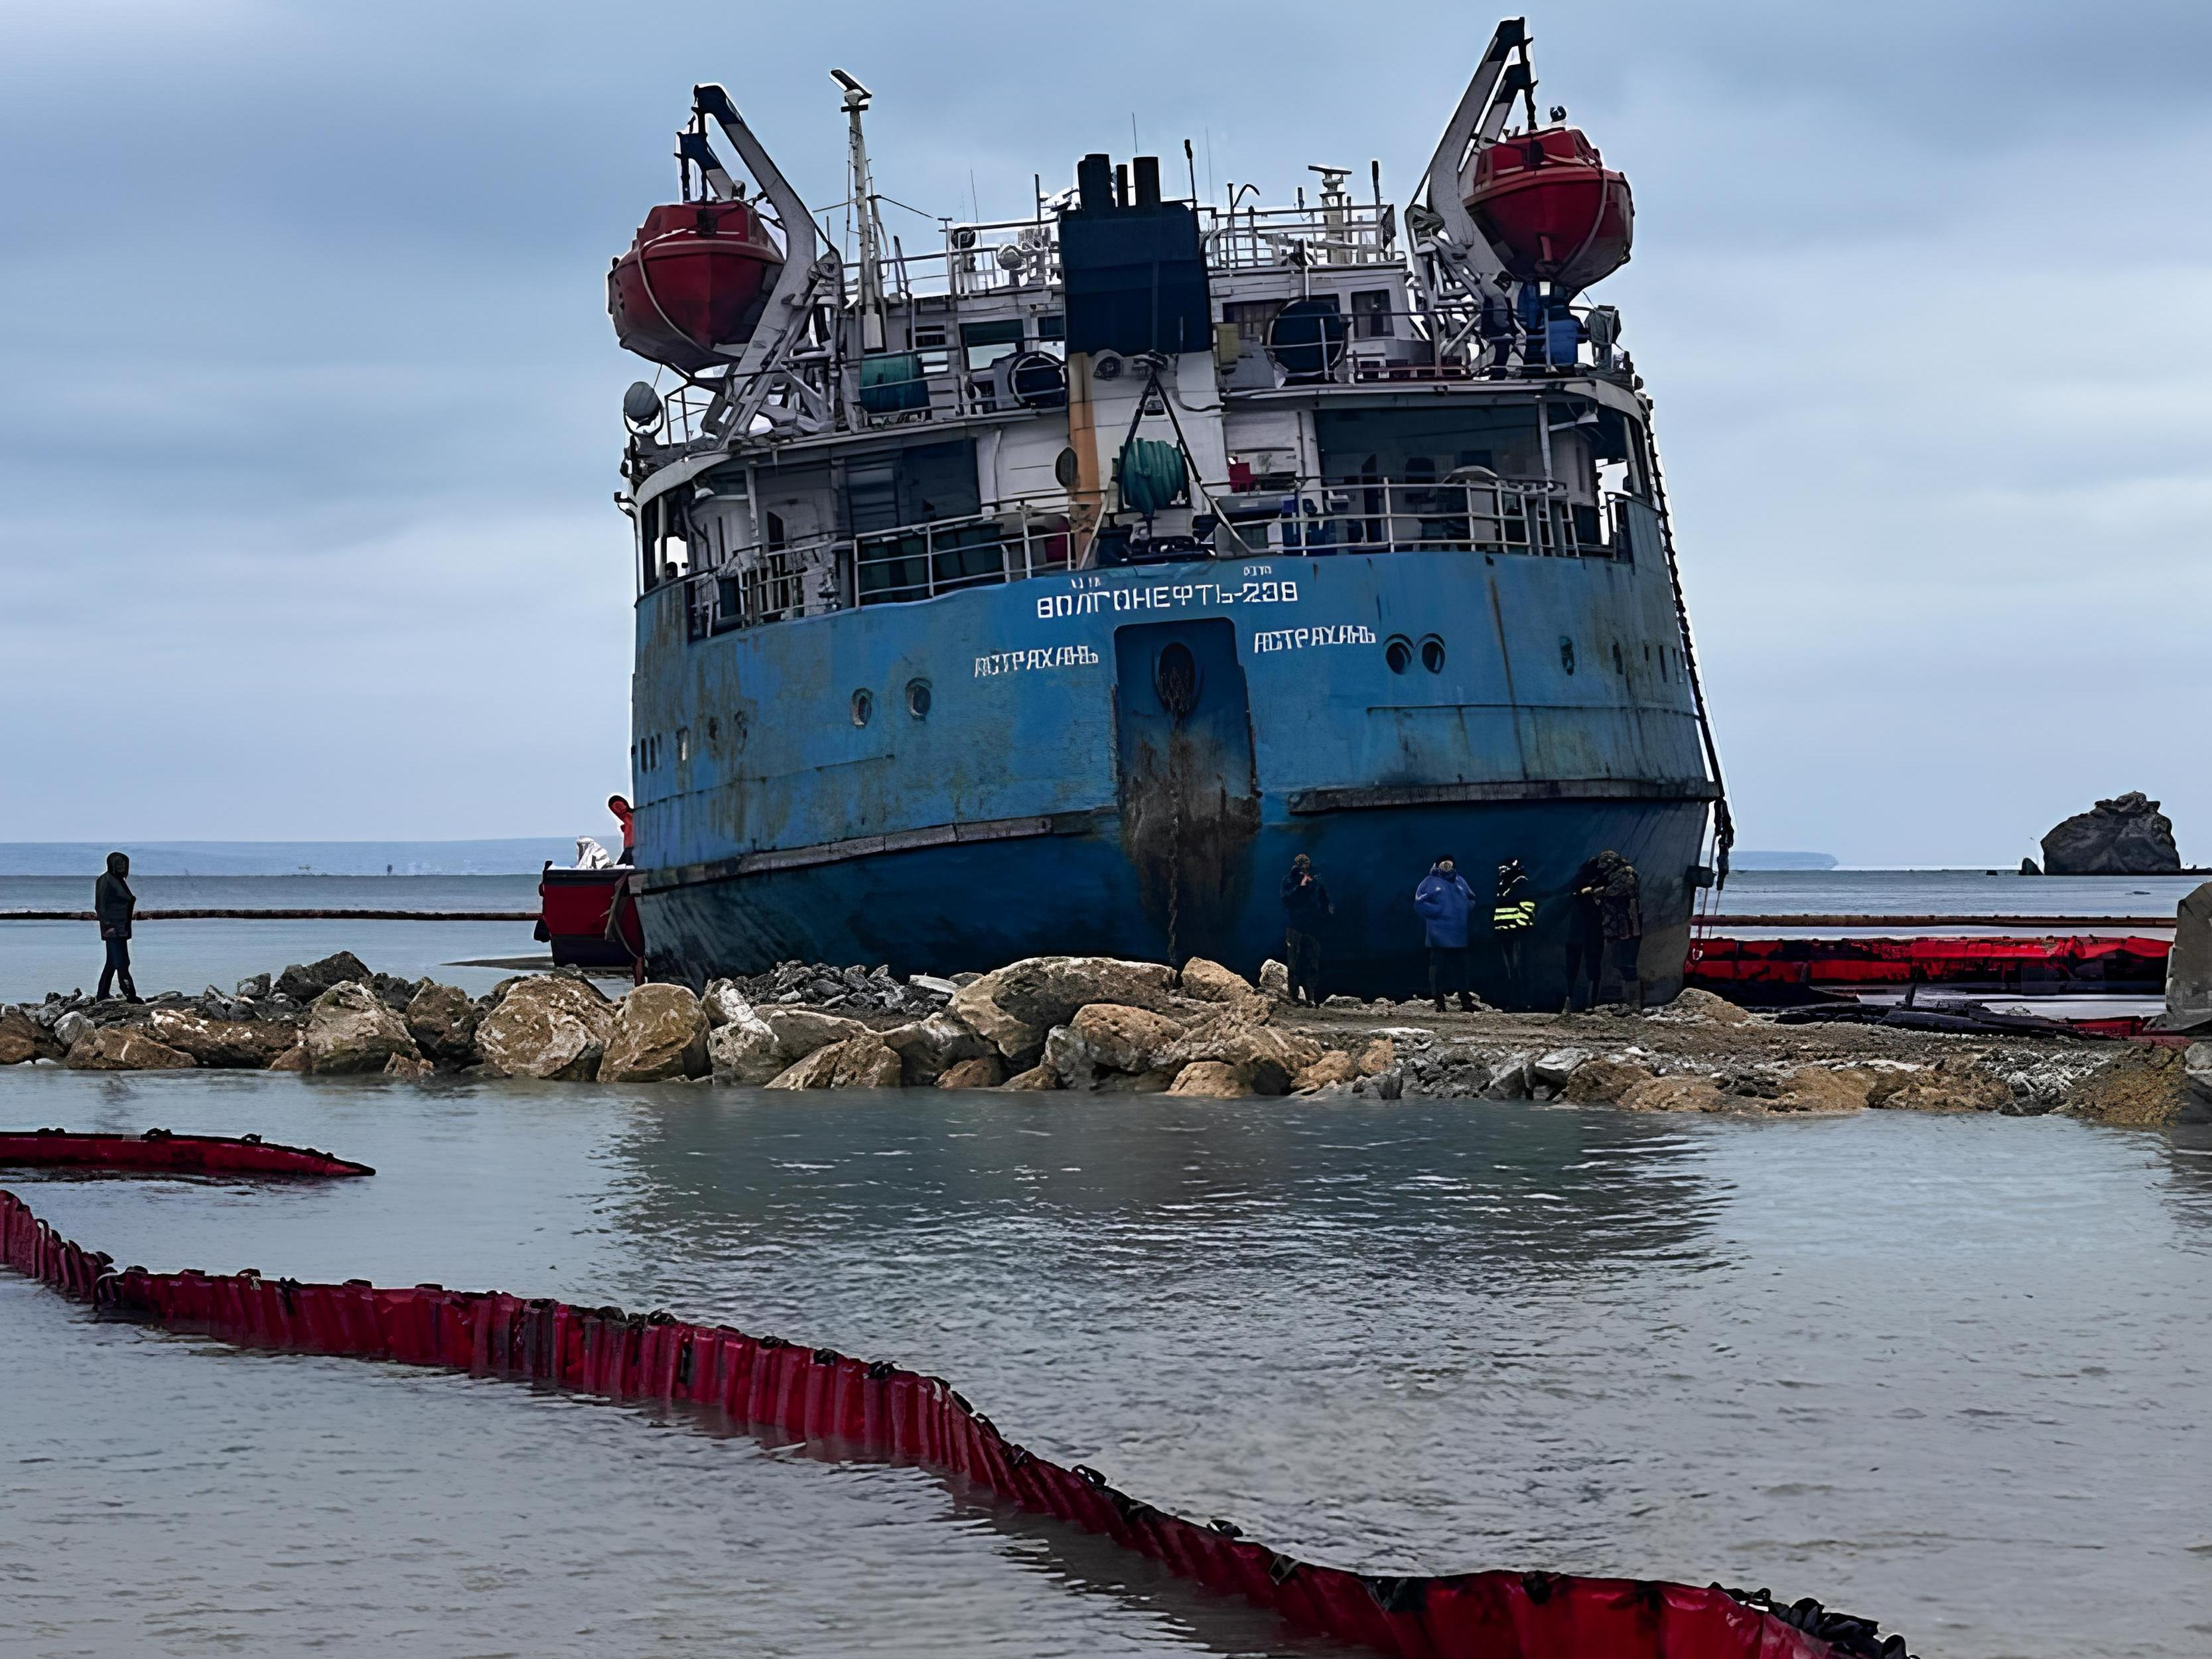
In January 2025, the stern section of Volgoneft-239 lay grounded in shallow water near Cape Panagia. It was an enormous wreck, visible from shore, with fuel oil in four tanks. A protective embankment and access road were built around the hull. The vessel’s equipment was restored. To make the viscous fuel oil pumpable, it was heated to approximately +45°C using the ship’s systems and steam supply. The fuel was then transported away in heated, sealed bitumen tankers. Photographs, videos, technical details of the operation and daily interim figures were made public.

On 20 January, the first 70 m³ were reported; on 22 January, 727 tonnes; on 23 January, more than 1,100 tonnes; and on 24 January, approximately 1,300 tonnes. According to the final report on dismantling the wreck, more than 1,400 tonnes of fuel oil and other fuel had been pumped out before the hull was cut up, its compartments had been cleaned, and dismantling was completed in March 2025. All this can be checked against the sequence of public reports and photographs. This was not an abstract statement that “a special commission confirmed it”: the technology, the object, the quantity and the outcome were materially documented.
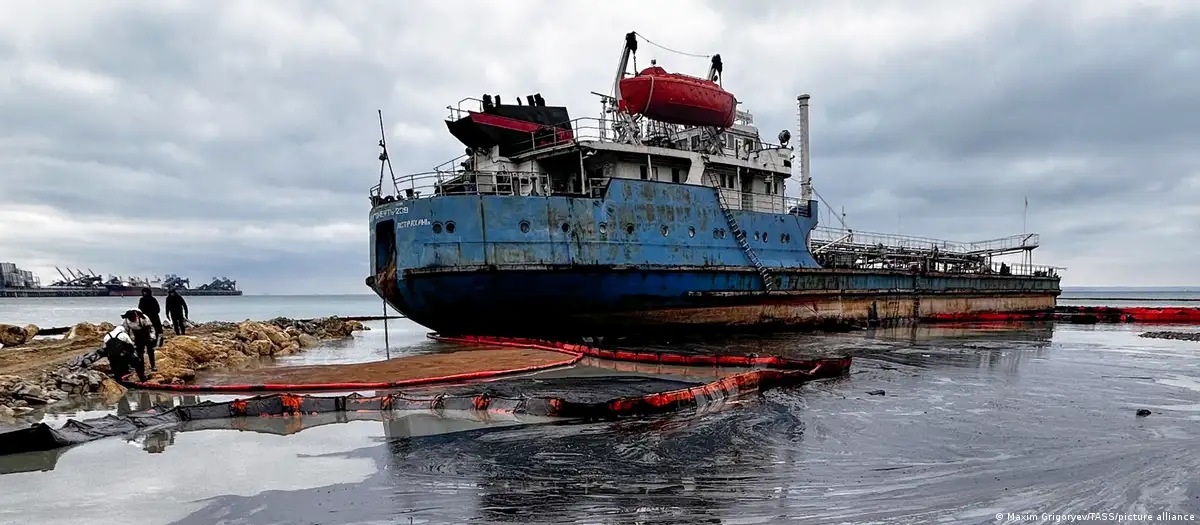
Grounded stern section of Volgoneft-239 near Cape Panagia during the January 2025 response operation
Photo 1. The stern section of the tanker Volgoneft-239 grounded near Cape Panagia during the response operation, January 2025. Photo: Maxim Grigoryev / TASS / picture alliance.

Now compare that with the three sections lying on the seabed at a depth of about 20 metres. In March 2025, russia’s Ministry of Transport published a plan involving three heavy protective cofferdams, sealing the wrecks, pumping out fuel oil beneath the enclosures and subsequently raising the sections. Preparatory work and removal of superstructures were reported later as well. As recently as March 2026, according to RBC, the russian government still estimated that roughly 2,000 tonnes remained in the bow section of Volgoneft-212 alone. The scale of the operation was therefore well understood, and the engineering challenge was far more complex than at Cape Panagia.

So what was reported on 21 August and 25 September 2026? “Pumping completed”; “commission confirmed”. But where is the video of the actual underwater operation? Where are the figures for the fuel oil truly recovered, its transport and its ultimate disposal or use? Photographs of preparations for installing cofferdams do not prove that pumping was completed. Why did authorities who readily reported virtually every bitumen tanker in 2025 now confine themselves to a declaration?

There is also a financial dimension. The stern section could be enclosed by an embankment, heated using its own systems, and its product pumped into land transport and sold. An underwater operation requires heavy isolation structures, diving and offshore work, different engineering and different budgets. Who commissioned and financed it? Where are the acceptance certificates, actual quantities of recovered fuel oil and documents tracing what happened to it? These are elementary questions that an operation of this scale ought to answer.

2. Where did thousands of tonnes go — and why have the plumes not disappeared?

Together, the two tankers were carrying about 8,450 tonnes of heavy fuel oil. According to estimates by the International Oil Pollution Compensation Funds (IOPC Funds), as much as 5,000 tonnes entered the sea during the accident. More than 1,400 tonnes were subsequently pumped out of the stern section of Volgoneft-239, which had grounded in the shallows near Cape Panagia. Yet a full accounting of the fuel oil remaining in the sunken sections and already released into the marine environment has still not been made public.

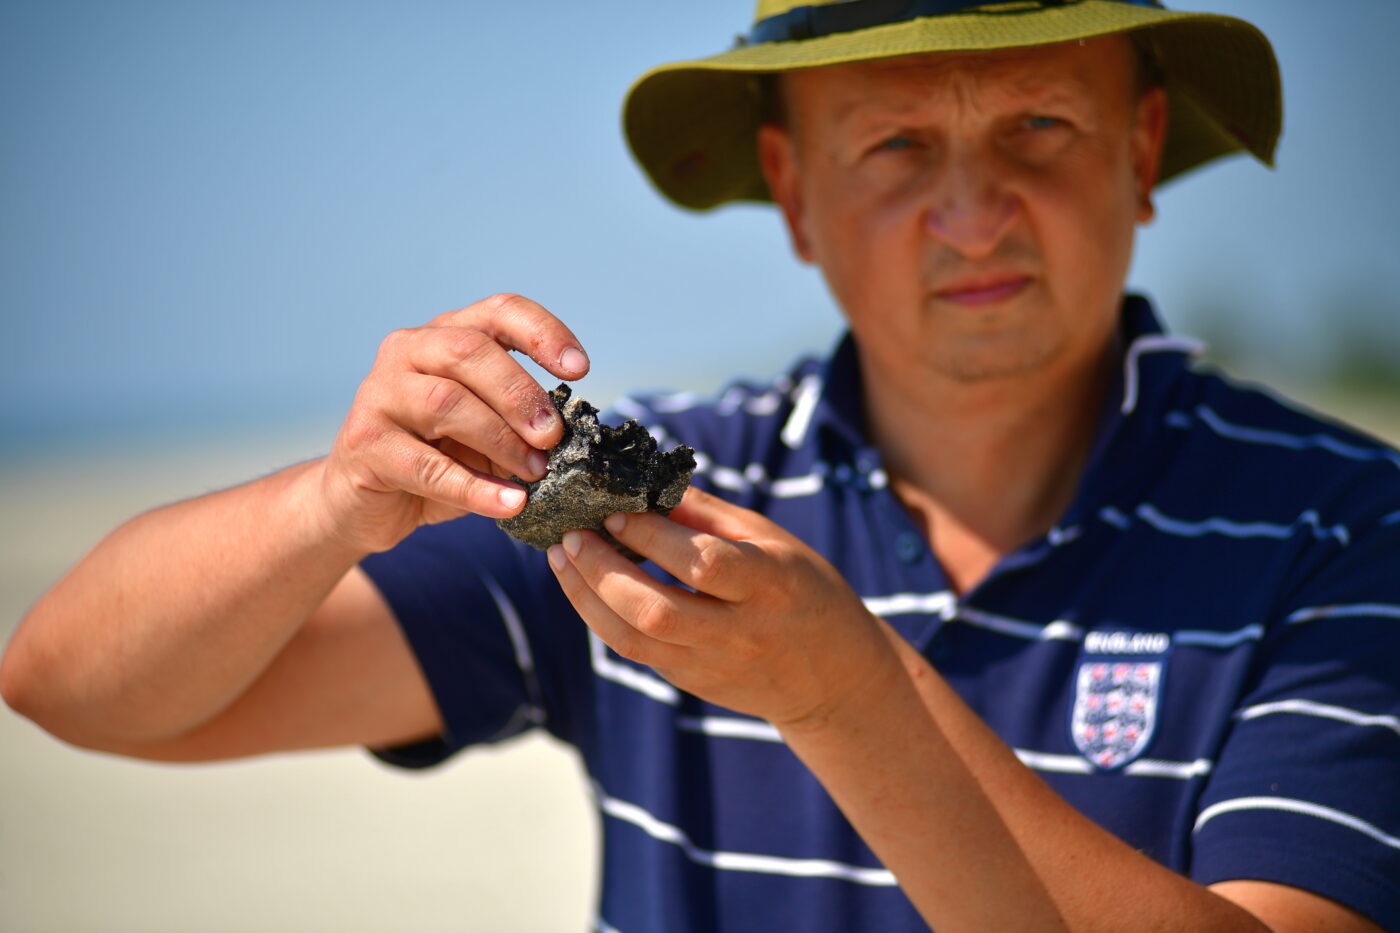
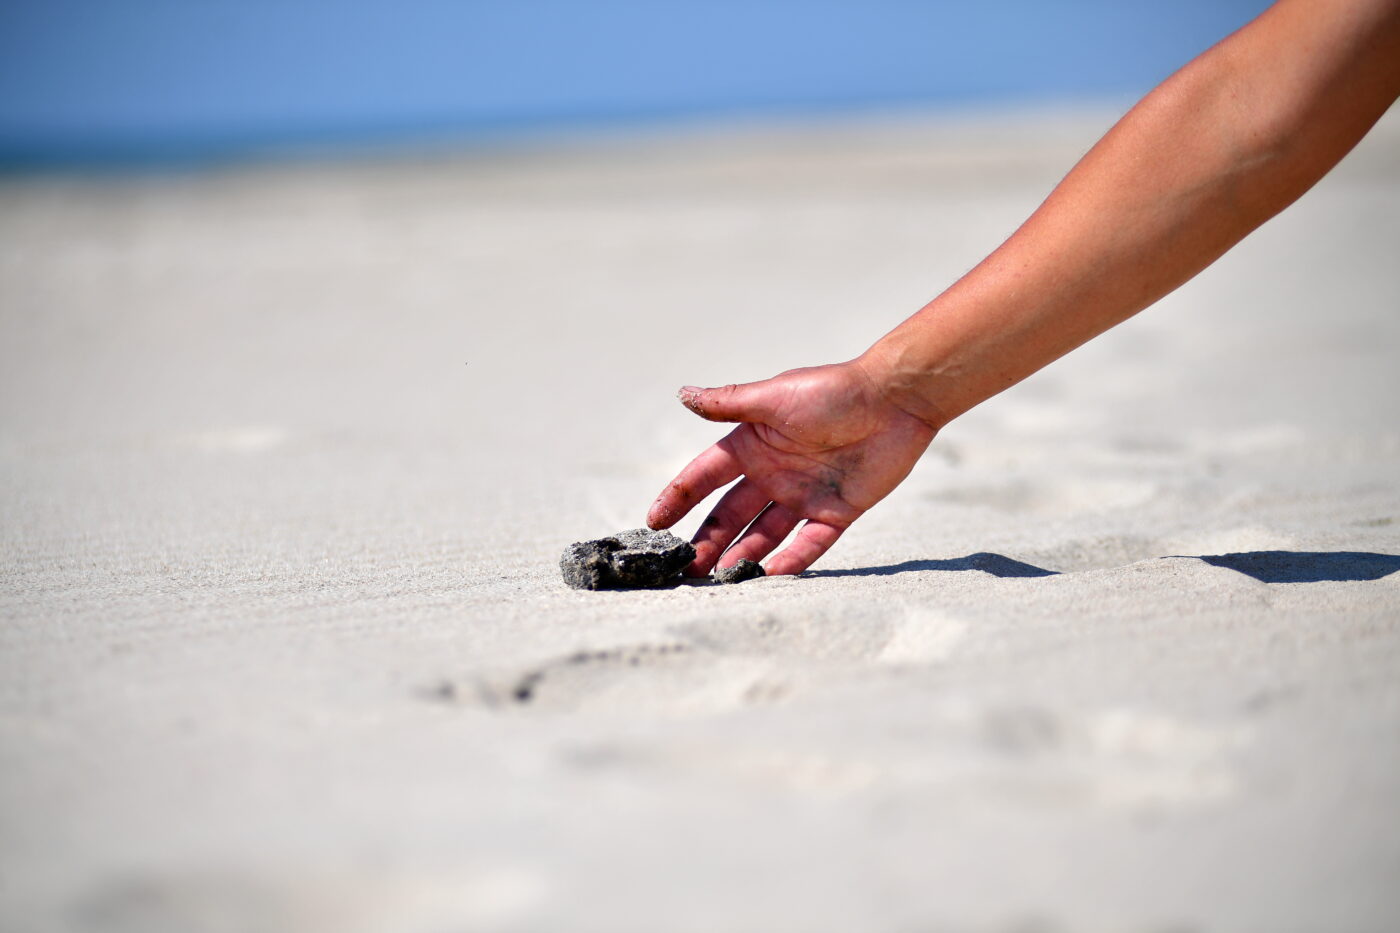
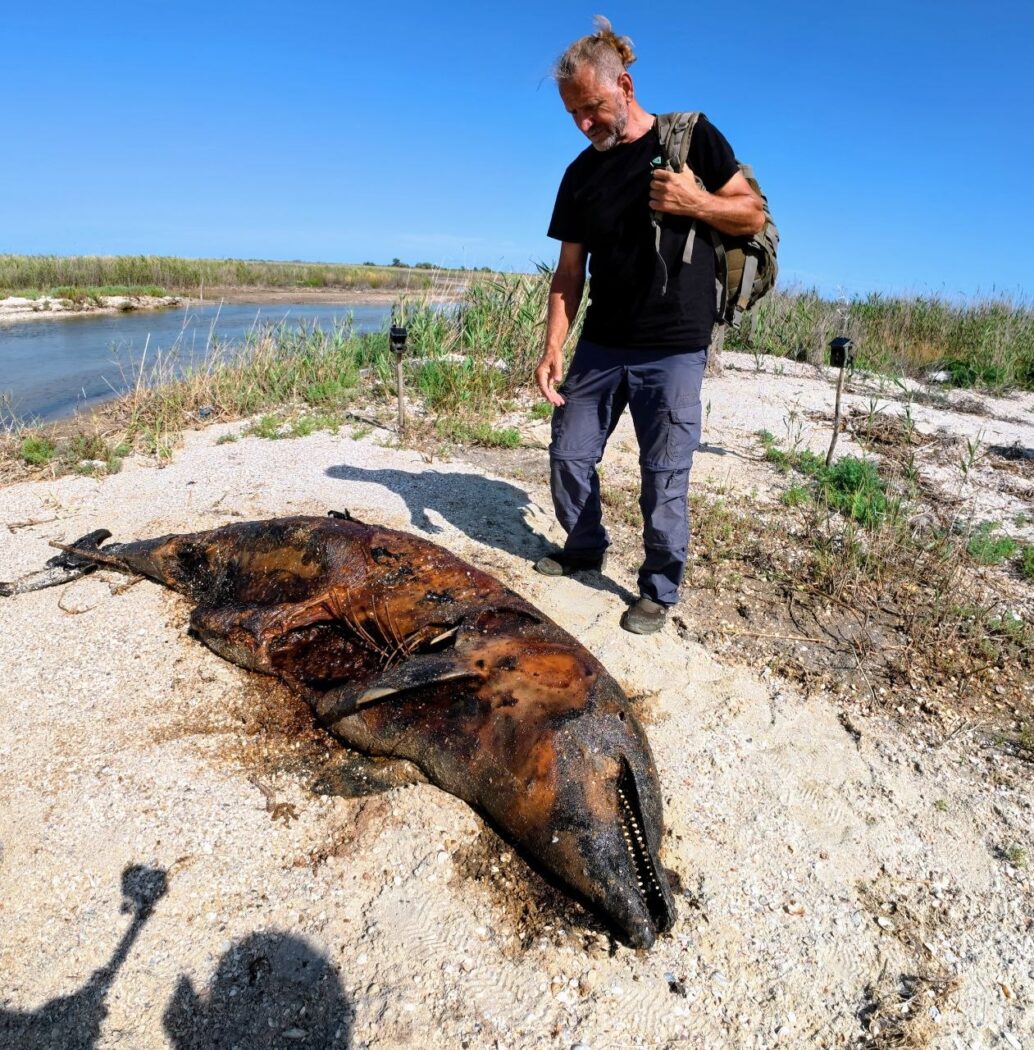
The consequences of the disaster did not end with the initial spill. A substantial amount of heavy fuel oil settled on the seabed and accumulated in coastal sediments, forming reservoirs of secondary contamination. Under the influence of storms and currents, these deposits can once again release fuel oil into the water and transport it onto the shore. Repeated strandings were observed around Anapa, Vityazevo and the Bugaz Spit. Lumps of fuel oil were found even along the coast of Tuzly Lagoons National Nature Park, more than 600 km from the accident site. Field surveys in 2026 found both fresh fragments and older residues beneath a layer of sand. Thus, contamination continues to manifest itself far beyond the disaster area, despite official claims that the problem has been “eliminated”.

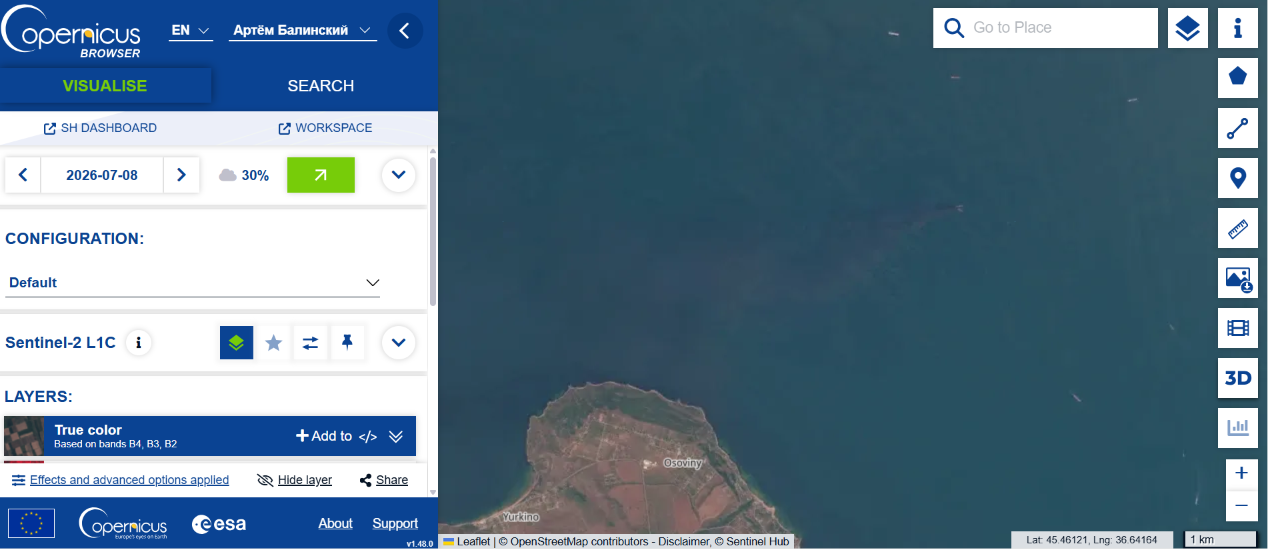
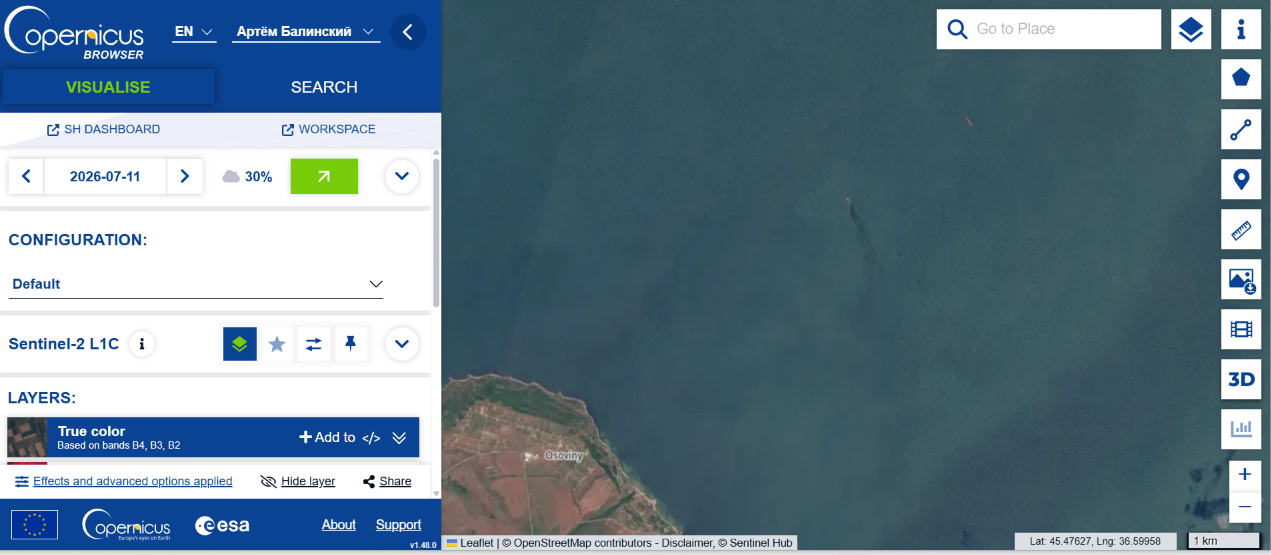
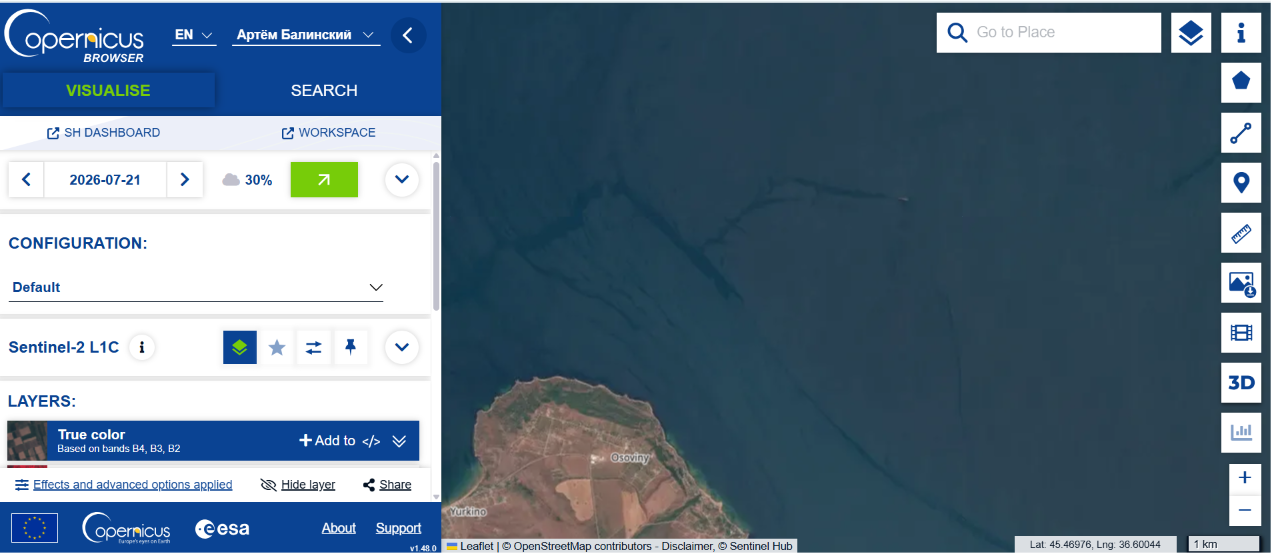
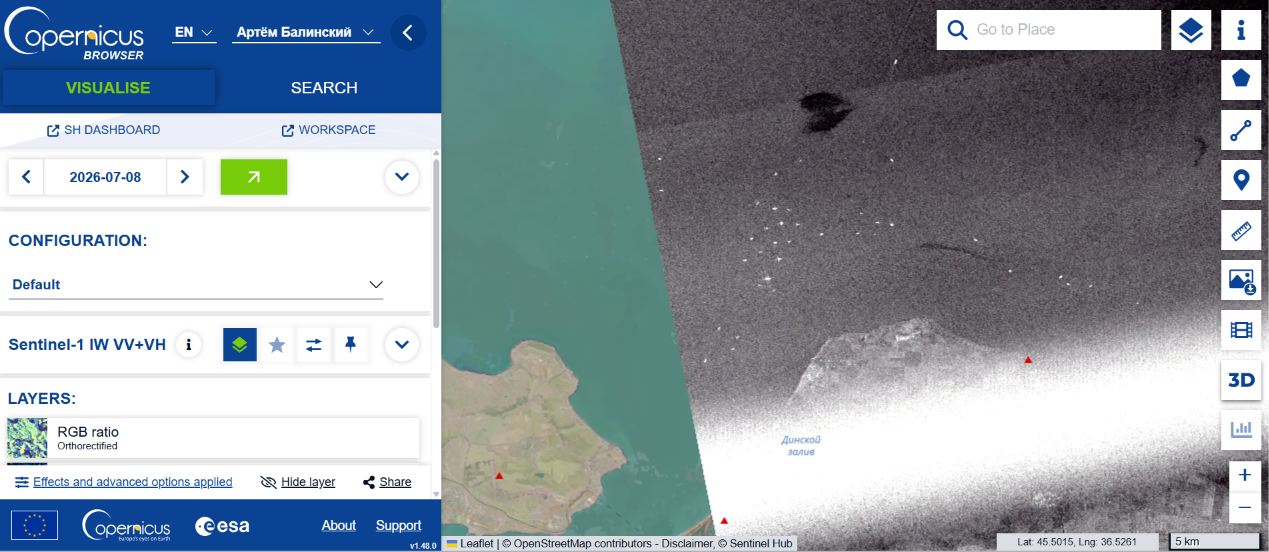
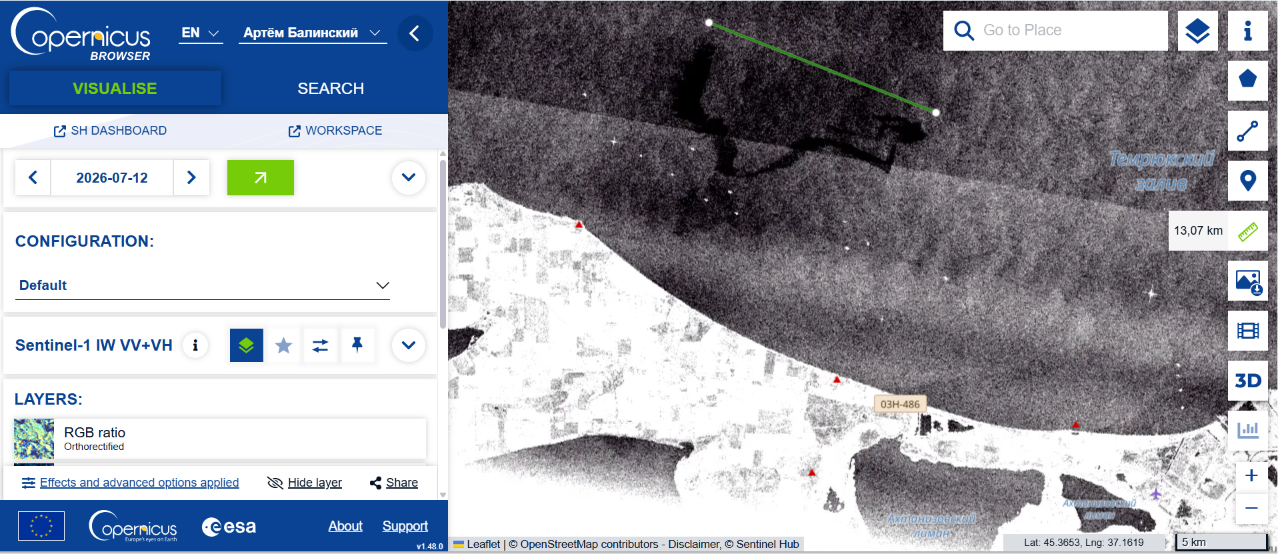
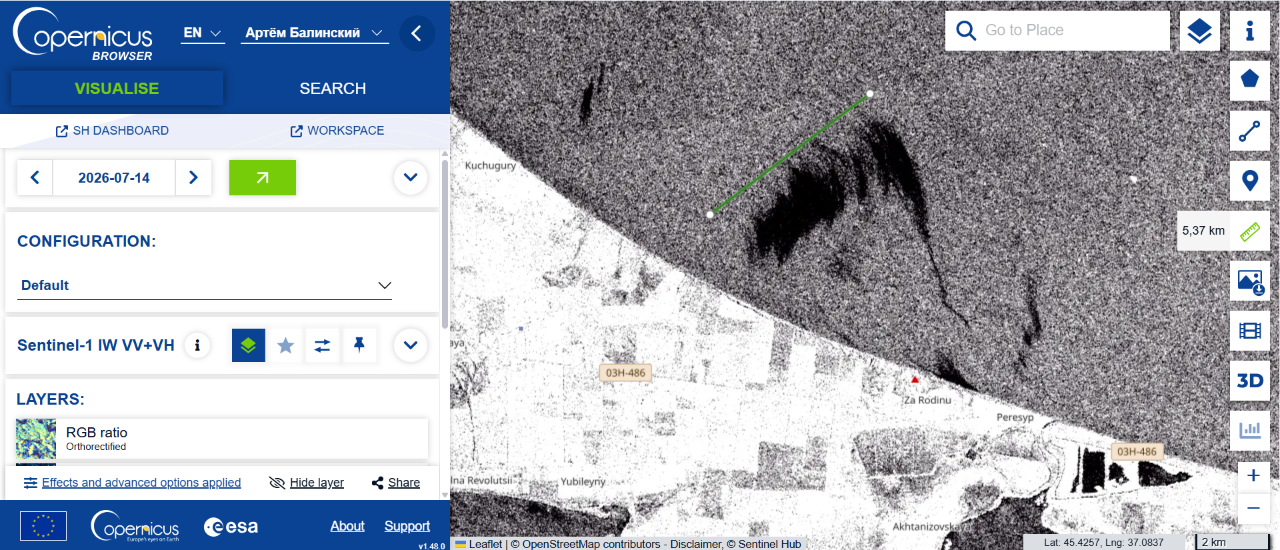
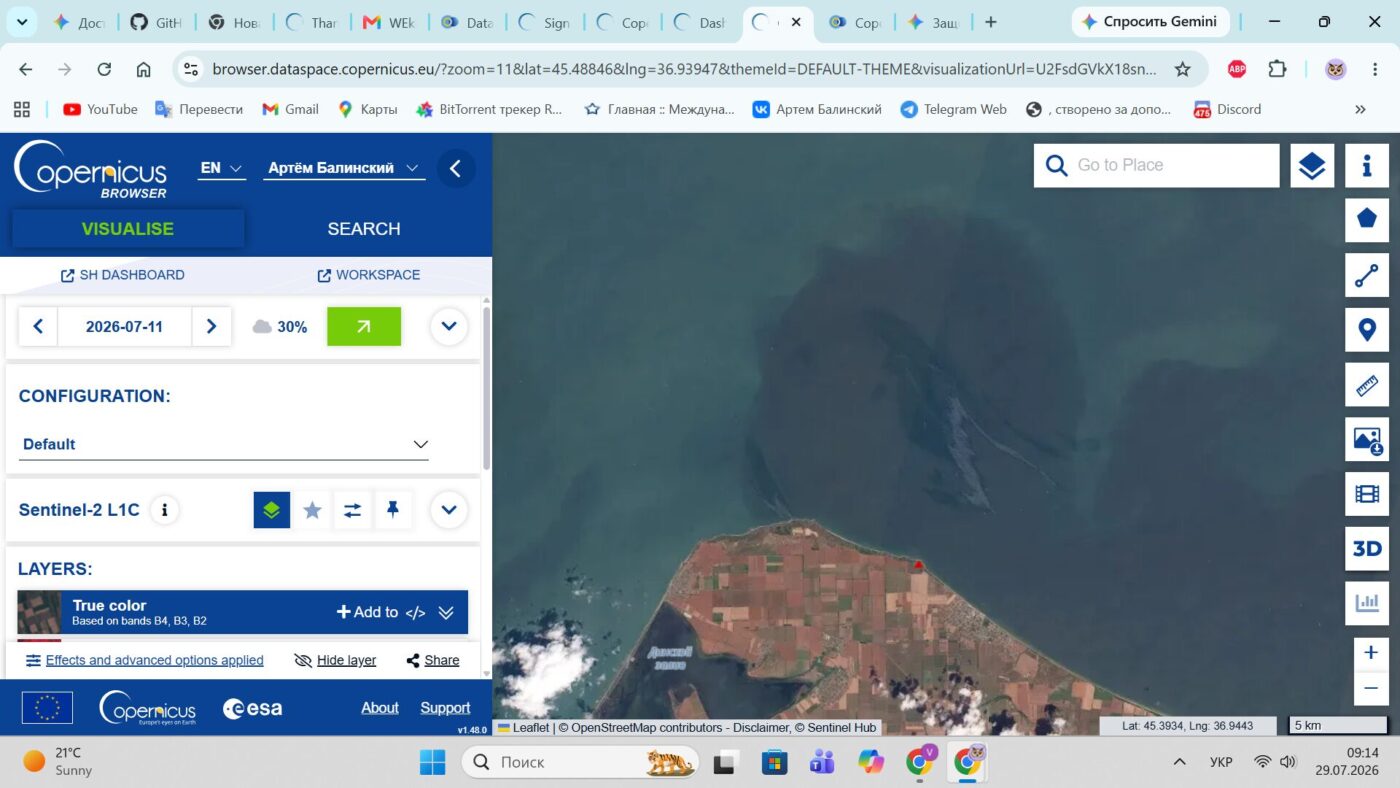
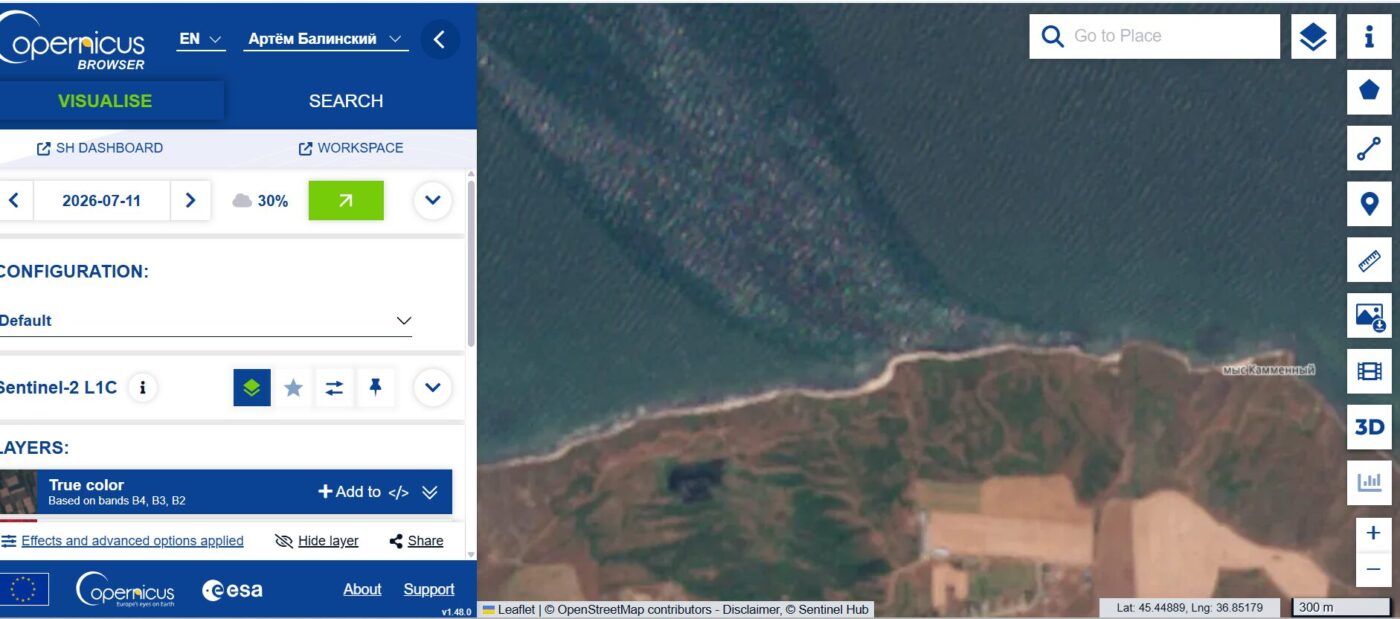
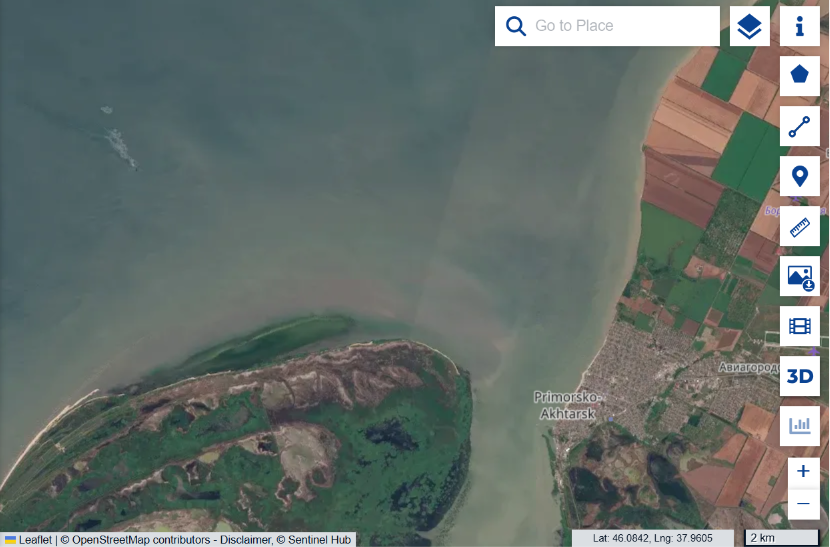
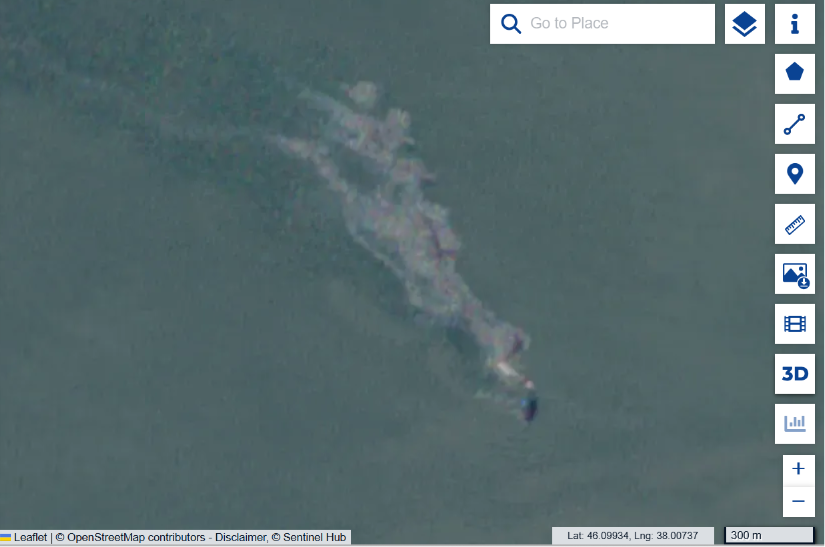
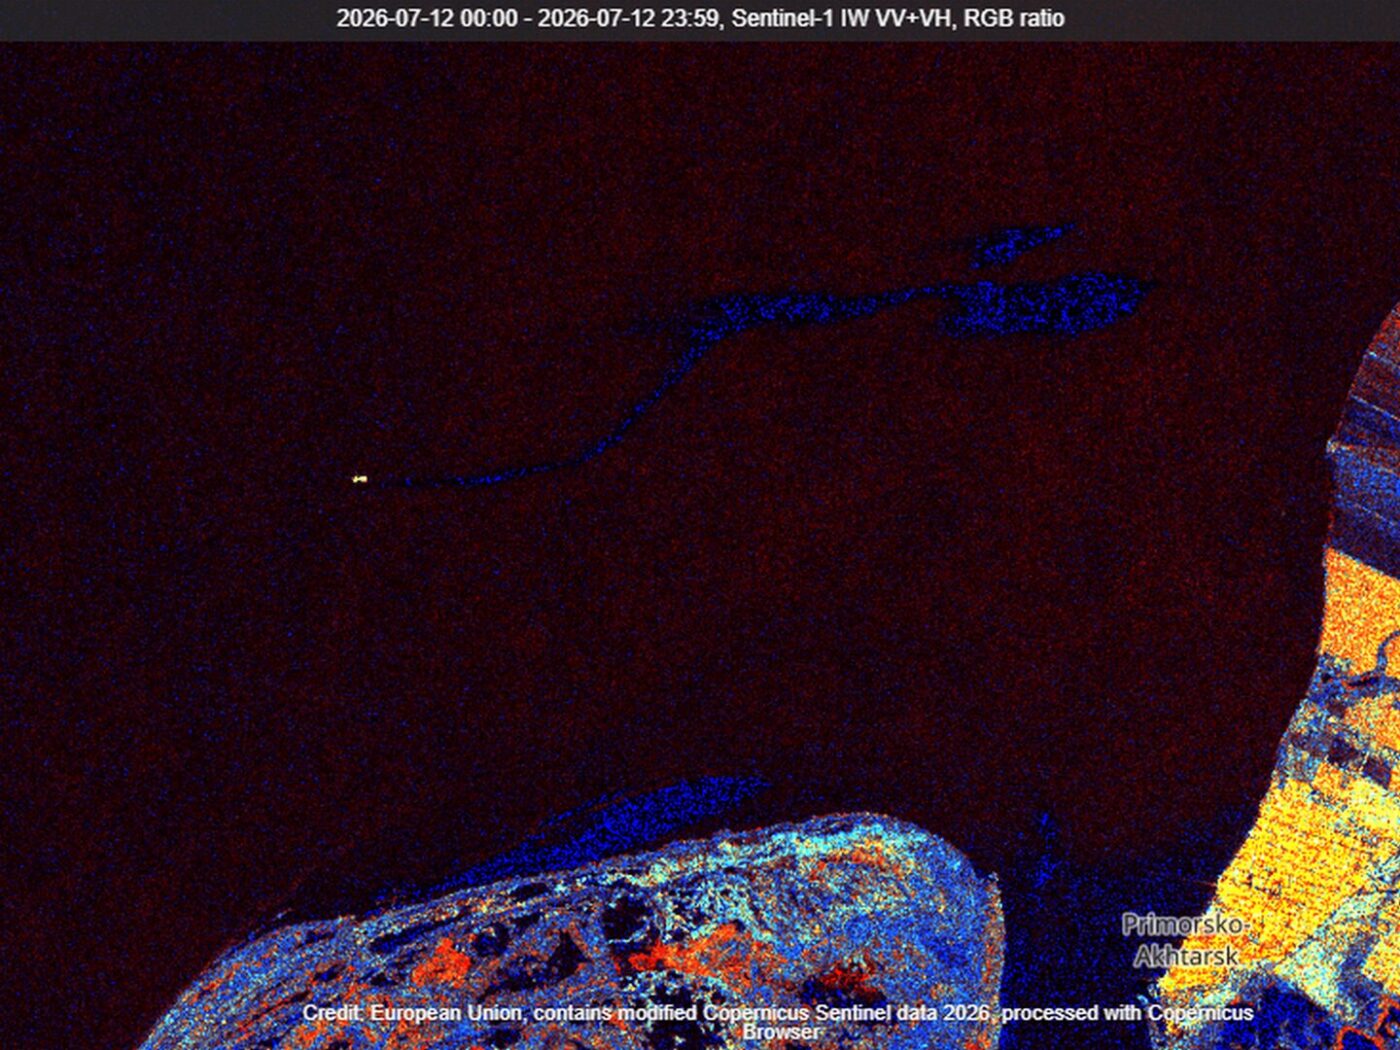
From December 2024 to 21 October 2026, we accumulated hundreds of archived satellite scenes. Throughout this period, extensive plumes have repeatedly appeared, with their initial sections located near the same sunken tanker fragments. This continuous series of observations makes it possible to compare conditions in the area before and after the purported “pumping operation”.

For comparison, let us look at three representative images from 2025, before completion of the underwater pumping was announced.
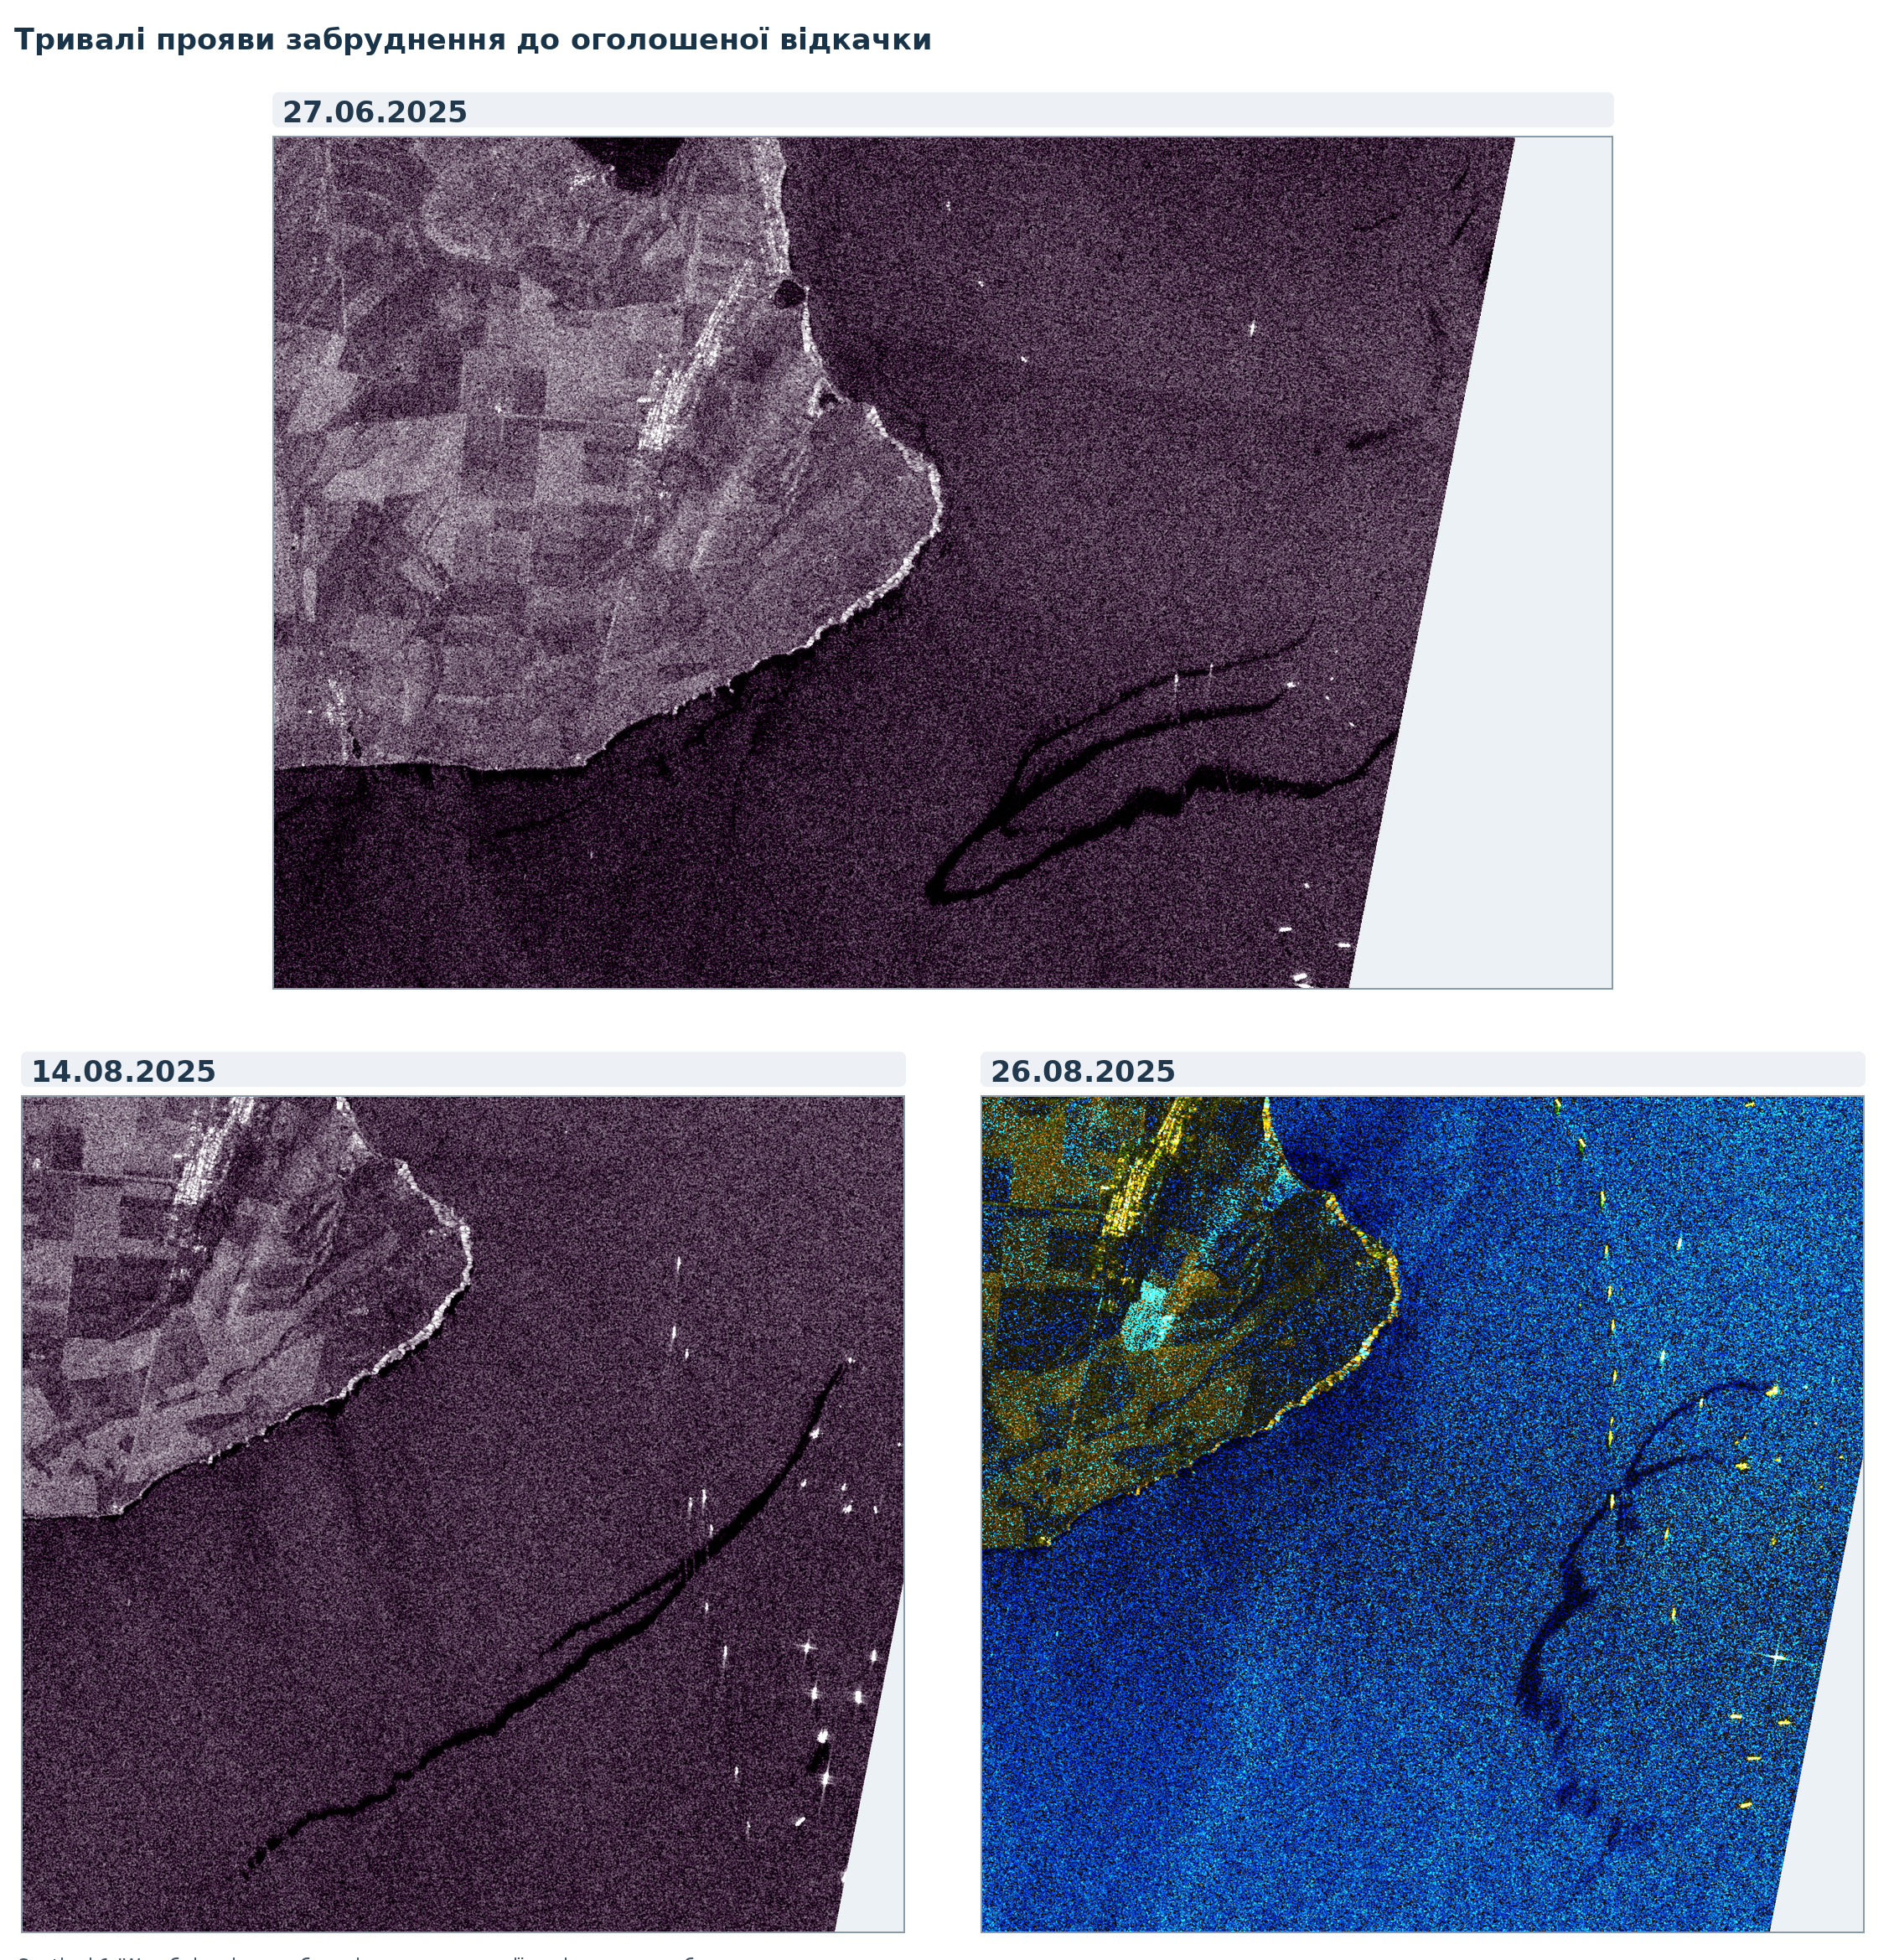
Three Sentinel-1 radar scenes dated 27 June, 14 August and 26 August 2025 with dark plume-like signatures
Figure 1. Sentinel-1 radar scenes dated 27 June, 14 August and 26 August 2025. Extensive plume-like signatures before the announced pumping operation. Source: Copernicus Sentinel-1; selection and analysis by V. Balinskyi.

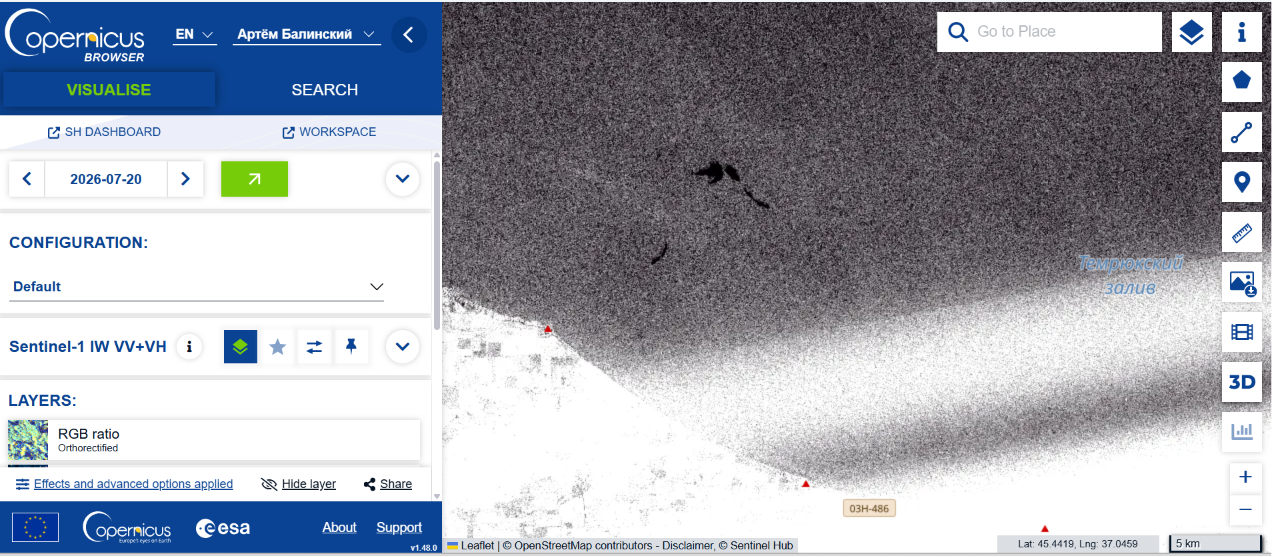
Sentinel-1 radar images dated 5, 9 and 21 October 2026 — all after the official announcements that pumping had been completed — again show extensive dark, plume-like structures near the locations of the sunken wreck sections. Compared with previous months, I see no appreciable reduction in the intensity of these signatures or shift in the places where they form. To me, this is evidence that the public messaging about “cleaned-up waters” does not match the observed picture of persistent contamination.
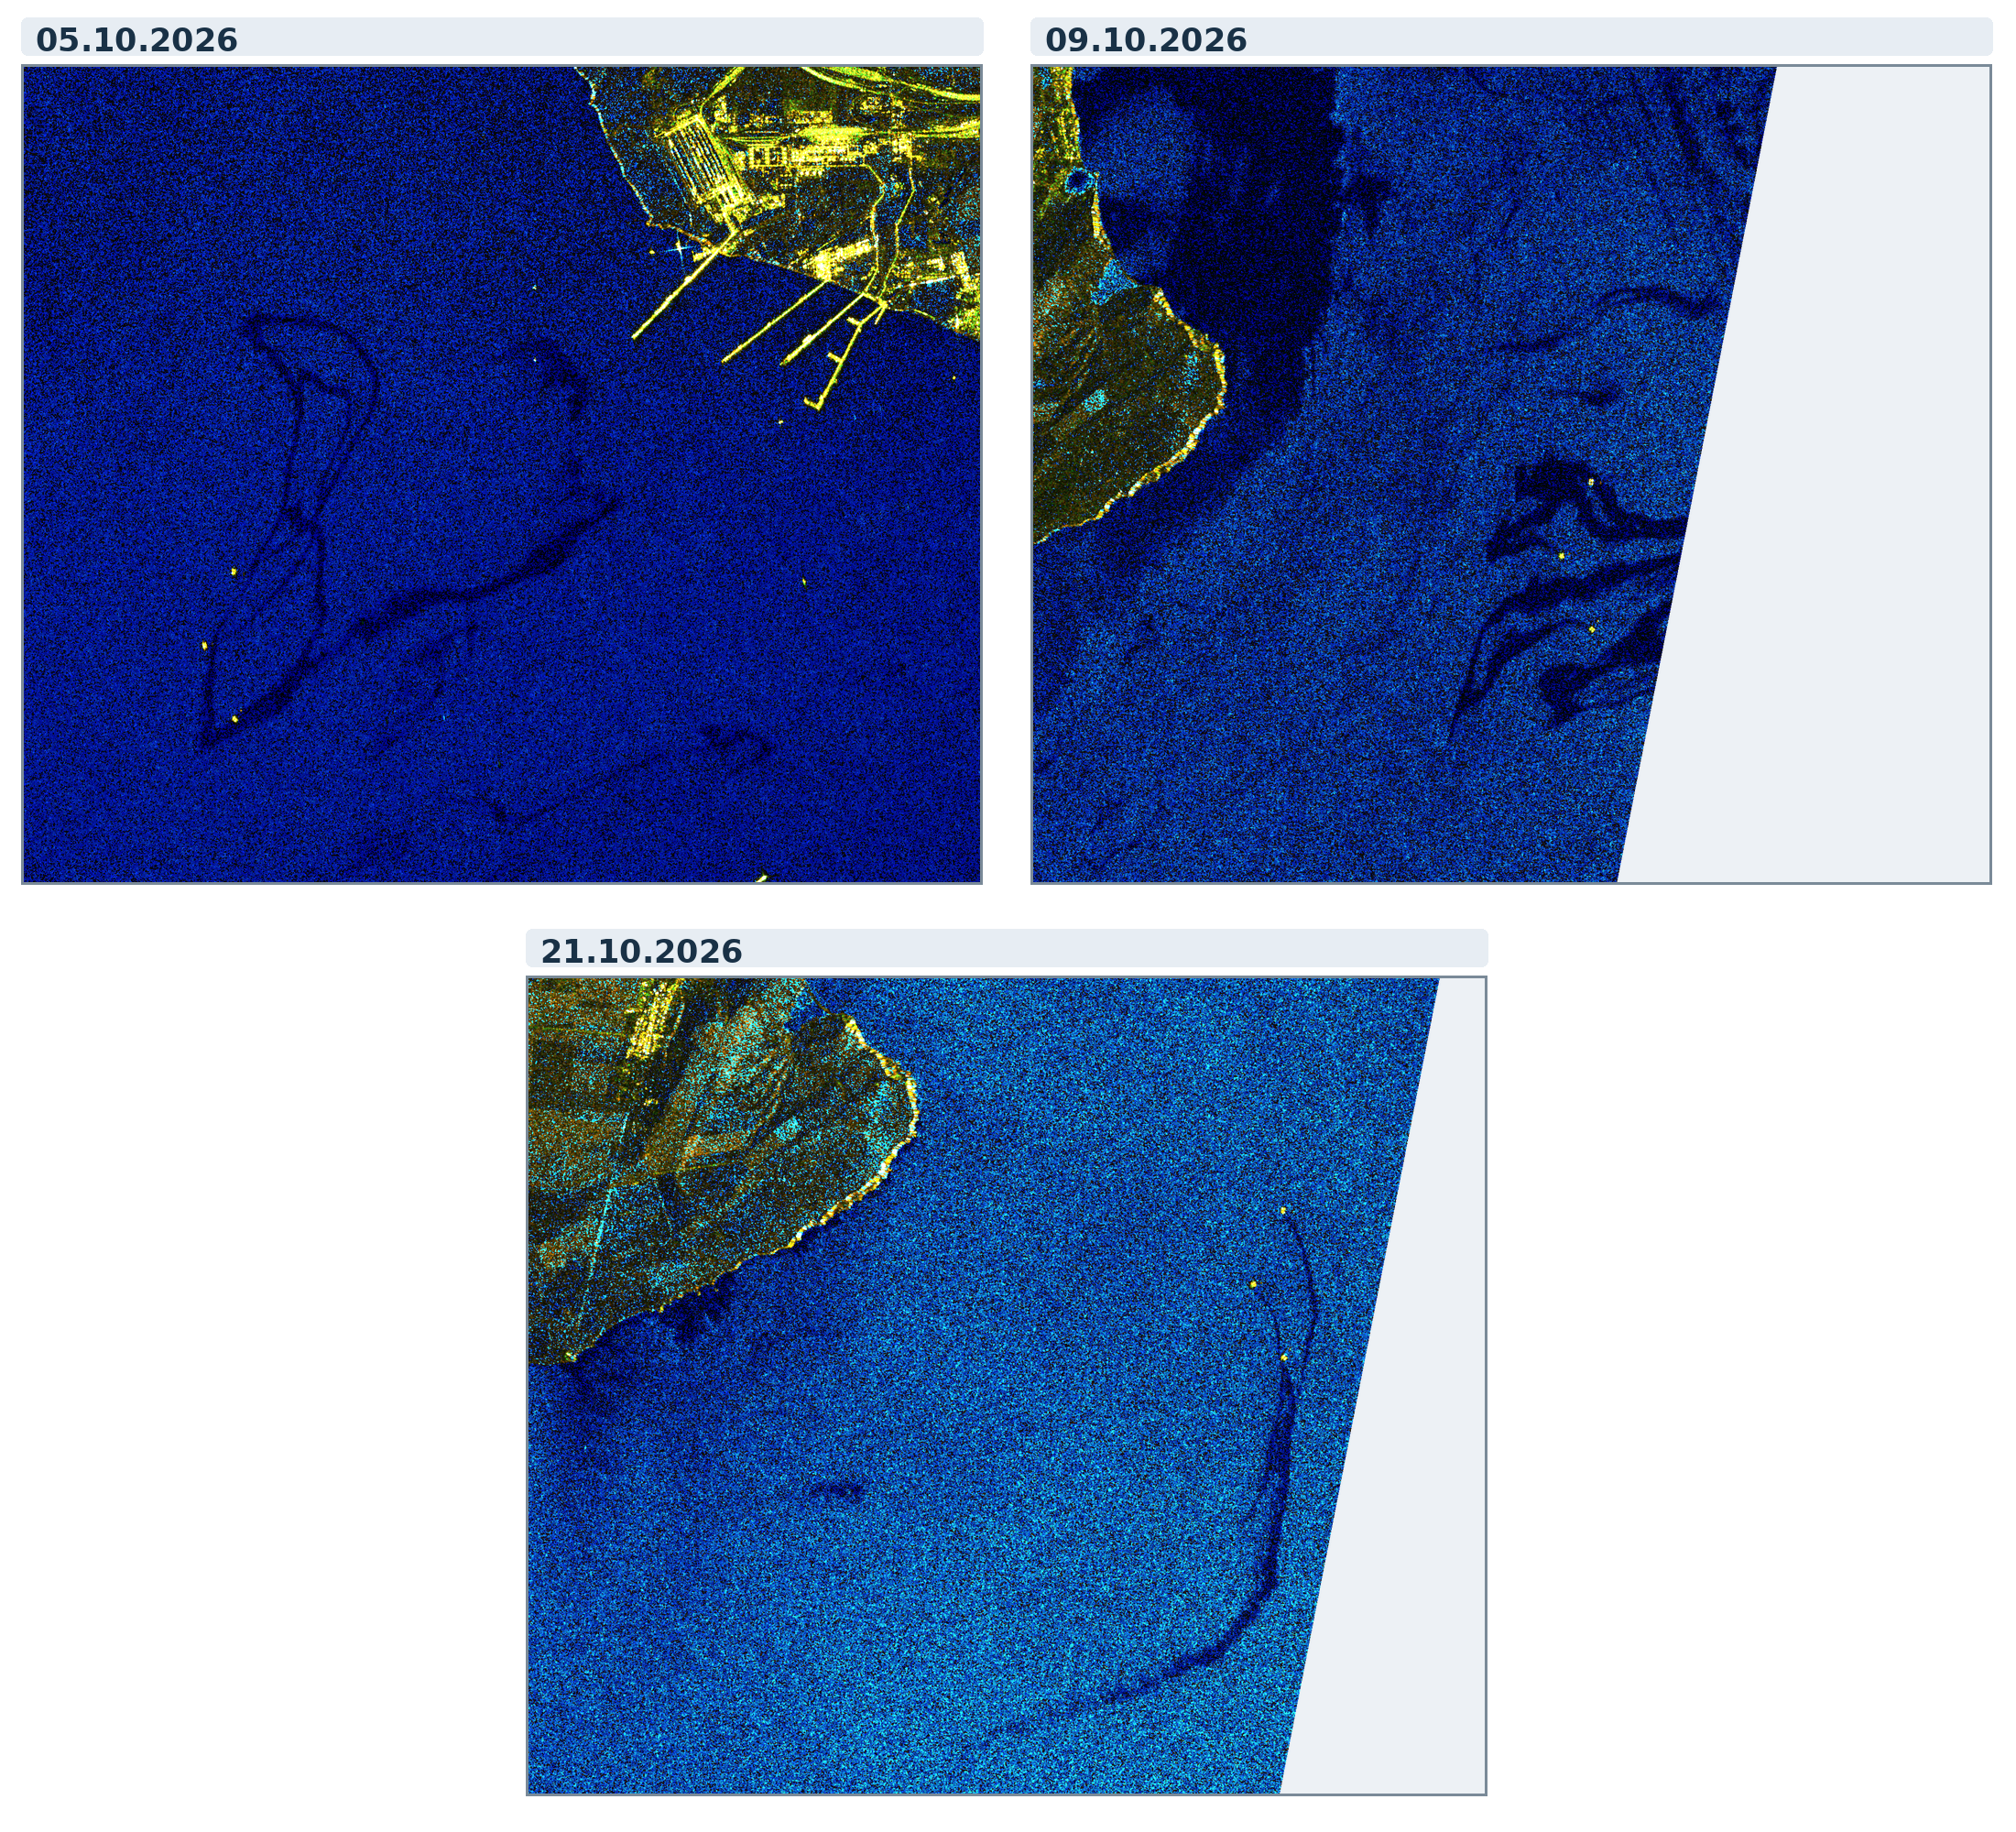
Three Sentinel-1 radar scenes dated 5, 9 and 21 October 2026 with dark plume-like structures
Figure 2. Sentinel-1 radar images dated 5, 9 and 21 October 2026. Source: Copernicus Sentinel-1; selection and analysis by V. Balinskyi.

For me, this is the central contradiction. If the submerged tanks really were completely emptied, why do plumes keep appearing near the same objects? If some of the signatures result from the secondary release of fuel oil that previously settled on the seabed, on what grounds were the waters declared “cleaned up”? In either case, a press release cannot substitute for actual results from marine monitoring.

3. Why announce victory now? August, September, October

More than twenty months passed between the accident on 15 December 2024 and the first announcement that underwater pumping had been completed. On 21 August 2026, completion of the work was announced; on 25 September, the outcome was repeated and the affected waters were declared clean. On 9 October, the US president announced an agreement on russian diesel supplies and temporary sanctions relief. On 15 October, Reuters reported that exports had resumed and that a tanker carrying 40,000 tonnes of diesel, loaded at the Baltic port of Primorsk, was heading to Morocco.

This sequence warrants political scrutiny. russian petroleum products are returning to international markets, the russian authorities are demonstrating an ability to supply them, and it is precisely at this time that one of the most serious heavy-fuel-oil disasters in recent years is declared resolved. We do not have a direct document proving that the dates of specific press releases were coordinated with the diesel negotiations. But the coincidence of an environmental “success” with the restart of fuel trade is sufficiently advantageous to the Kremlin to raise the question of a deliberately planned information campaign.

This is where my main argument emerges: the unproven cleanup of the sea has become a convenient element in the image of “normal”, managed russian fuel trade. I see no meaningful environmental improvement in my satellite time series, and the final press releases contain no transparent technical account comparable to the operation at Cape Panagia. Therefore, until actual recovered volumes, an engineering report and independent monitoring results are made public, I regard the official “environmental victory” as an imitation rather than an established fact of cleanup.

4. The problem goes beyond Kerch — and did not begin with the war

The Volgoneft accident was not the result of Ukrainian strikes. Similarly, on 11 November 2007, Volgoneft-139 broke apart in a storm in the Kerch Strait: around 1,300 tonnes of heavy fuel oil entered the sea, and tens of thousands of birds were affected. These accidents are associated with the hazardous use of river–sea-class vessels, their technical condition and risky operating practices. We have examined the warnings issued by naval architect Gennady Yegorov and the accident record of Volgoneft-class tankers in detail in Green Leaf.

Moreover, the Kerch–Taman hub is only the central link in a wider network. Novorossiysk, Tuapse, Taman, Port Kavkaz and the transport routes serving them form a major Black Sea fuel-logistics system; Rostov, Azov, Taganrog and the occupied ports of the Sea of Azov are connected to the wider system of maritime and river transport. They serve different functions and not all are oil-loading ports. Nevertheless, accidents, transshipments and weak oversight spread risks far beyond their immediate locations. A particular hazard is the bidirectional, shifting exchange of water through the Kerch Strait and the subsequent transport of contamination by currents in the Azov and Black seas.

Map 1. Interactive map of environmental evidence from the Black Sea. Locations of documented cases of marine pollution. Map data are regularly updated.

Open the interactive map full screen ↗

Military strikes may add acute accident risks, but they did not create the underlying problem of an unsafe tanker fleet.

Shadow shipping arrangements, complex ownership chains, inadequate insurance, ship-to-ship transfers and technically deteriorated hulls are dangerous even in the absence of strikes. It is this systemic risk, which has already materialised repeatedly in the Azov–Black Sea basin, that russian fuel trade is now carrying into the Baltic Sea.
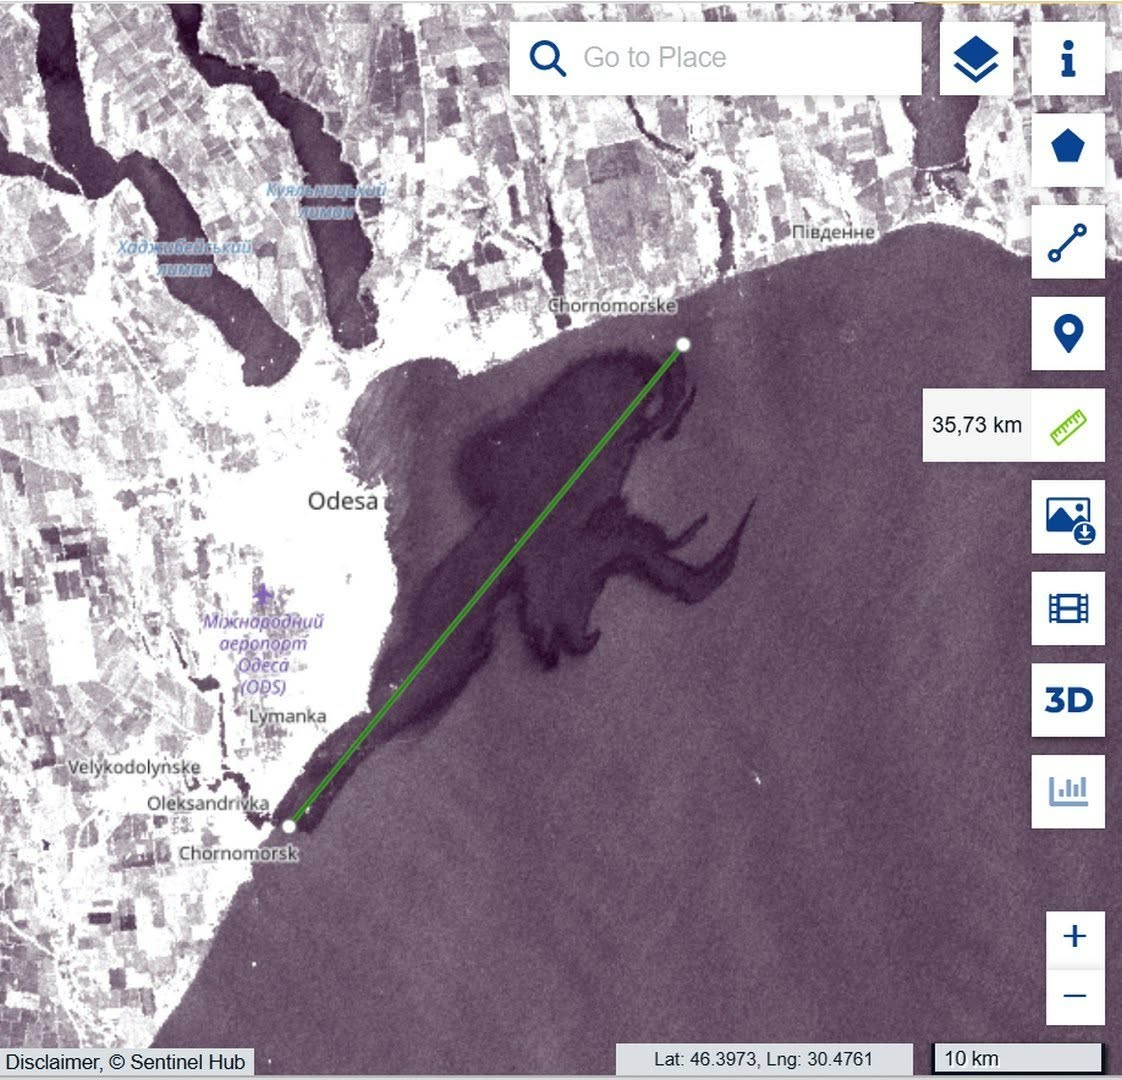
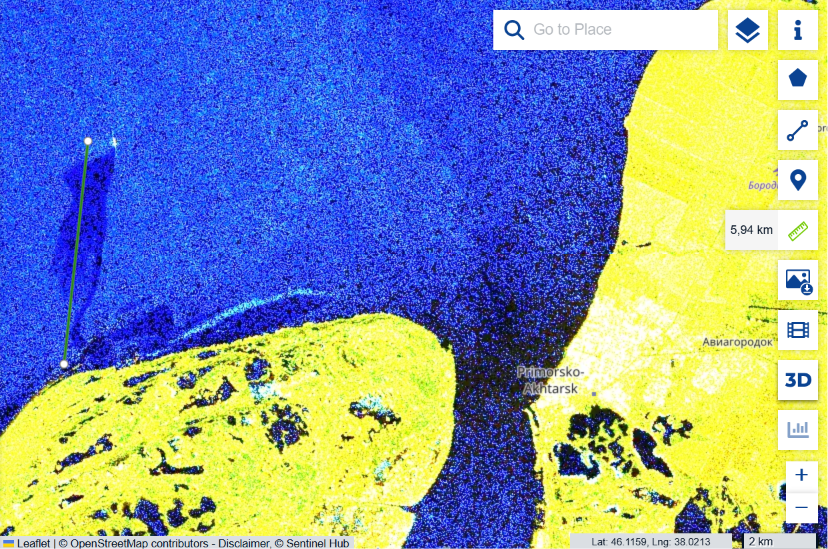
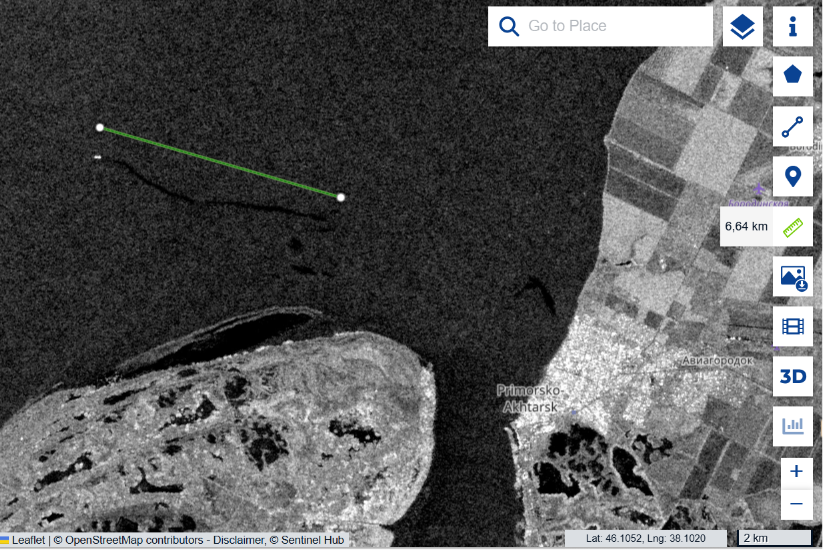
Copernicus Browser image near Chornomorsk with a green measurement line indicating 35.73 km
Figure 3. Satellite image of the waters near Chornomorsk following a vegetable-oil spill caused by a strike on port infrastructure. The green line marks a measured distance of 35.73 km. Source: Copernicus Browser.

5. The Baltic Sea: risks that cross borders

Primorsk, Ust-Luga and other Baltic-facing ports operate on the shores of a semi-enclosed sea characterised by restricted water exchange, seasonal ice, intensive shipping and particularly sensitive coastal and benthic habitats. According to Reuters, shipments of petroleum products from russian Baltic ports increased by 32.7% in August 2026 compared with July, while shipments via Black Sea and Sea of Azov ports fell by 25.3%. This indicates a shift in the structure of trade flows, although it does not mean that each cargo was literally transferred from south to north.

Here lies the second important strand of this story. In the Azov–Black Sea basin, we can already see the consequences of a hazardous transport system: ageing and technically problematic vessels, opaque operators, transshipments, prolonged spills and reservoirs of recurring contamination. Our satellite monitoring cannot capture every incident across such an immense area, but even the documented signatures demonstrate that these are not merely hypothetical risks. What is being transferred to the Baltic is not any one accident, nor necessarily the same vessels, but the fuel-logistics model itself — and with it, a threat to the entire region.

Researchers have already assessed the scale of that threat. According to a study by Sabine Knapp and colleagues published in Marine Pollution Bulletin, modelled oil-pollution risk exposure from oil tankers in the Gulf of Finland increased by approximately 133% between 2023 and 2024 alone. Vessels on the shadow-fleet watchlist account for 54% of estimated risk in the Gulf, compared with a global average of 16.4%. Assuming the underlying conditions remain unchanged, the researchers project further growth in that risk of approximately 2.7% per month. These are estimates of potential accident consequences, not quantities of oil already spilled. Nevertheless, the scale of the increase shows the price that this trade could exact on the Baltic Sea.
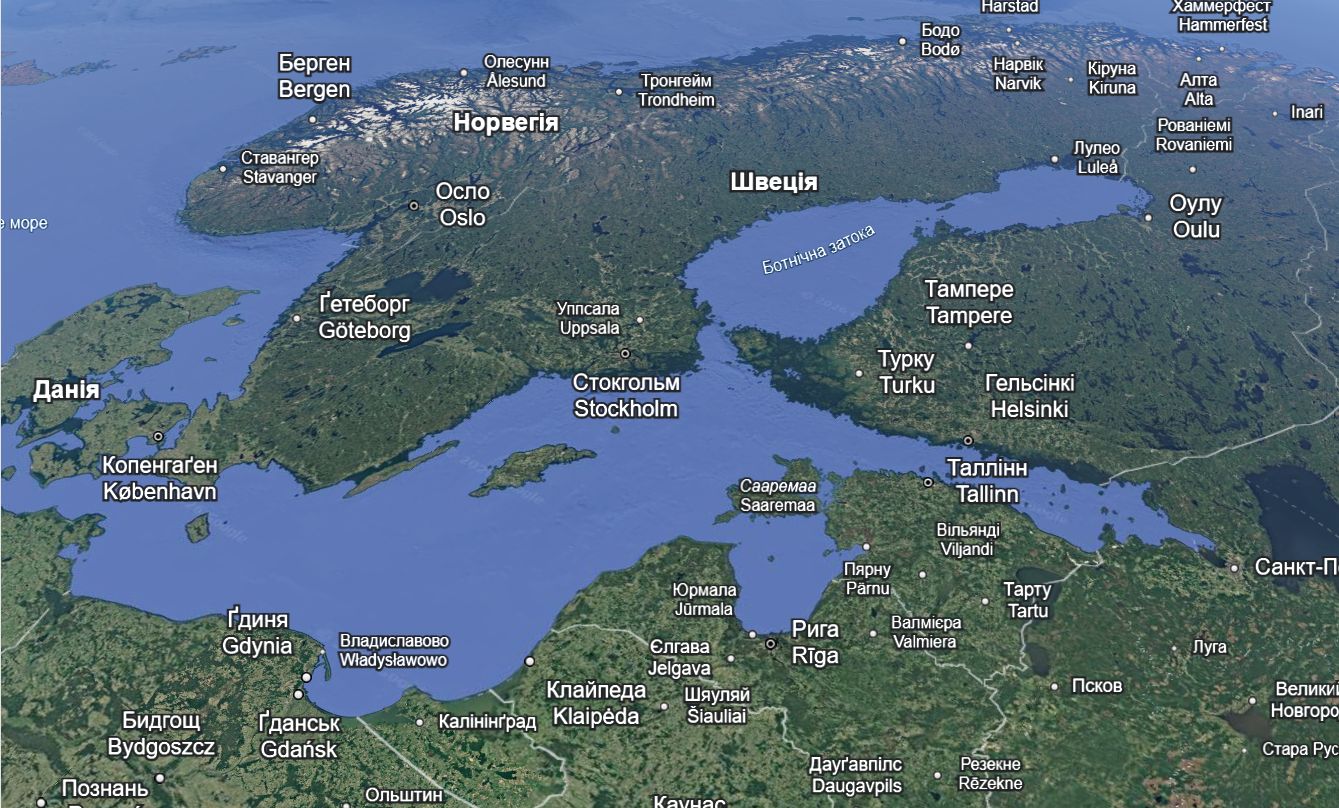
Map showing the Baltic Sea, Gulf of Finland and surrounding countries
Figure 4. The Baltic Sea and Gulf of Finland — geographic context of maritime transport risks.

In the Gulf of Finland, a major spill means far more than a slick temporarily visible on the sea surface. Relevant processes include dispersion, sorption onto suspended particles, accumulation of petroleum products in bottom sediments, secondary remobilisation and long-term effects on benthic communities and trophic networks. If the shipowner, operator, insurer and ultimate beneficial owner are opaque, the question of who will pay for cleanup, ecosystem restoration and long-term monitoring becomes no less important than the accident risk itself.

Natural conditions only compound the danger. The Baltic Sea is shallow and almost enclosed; according to HELCOM, complete water exchange with the North Sea takes approximately 30 years. A major accident here would therefore threaten not only the waters of a port but also the coastlines and marine ecosystems of numerous countries — Finland, Estonia, Latvia, Lithuania, Poland, Sweden, Germany and Denmark. Petroleum products transported by currents may accumulate in bottom sediments and coastal habitats, only to be released into the water again later. Restoring such ecosystems is vastly more difficult than removing a visible slick from the surface.

Conclusion: Fuel deals without environmental accountability

The story of the announced fuel-oil “pumping operation” in the Kerch Strait matters not only as an example of information manipulation. It shows how an unresolved environmental problem can be pushed off the political agenda by declaring it “eliminated” at the very moment international trade in russian fuel is resuming. Neither the recurring plumes in the Black Sea nor the systemic risks of tanker operations disappear as a result.

The Kremlin’s repeated references to the so-called “spirit of Anchorage” signalled a desire for broader political agreements with the United States, while the October diesel agreement demonstrated a very concrete economic interest. Yet public presentations of these arrangements leave out environmental consequences, the technical condition of vessels and the safety of European coastal states. Where verification and accountability are needed, the russian side offers announcements of “environmental victories”. Some reap the benefits of trade, while others — above all the countries of the Baltic region — may bear the risk of pollution lasting for years. We will continue to monitor the consequences in the Black Sea and show why a repetition of this scenario in the Baltic would be dangerous. Europe needs to assess the environmental cost of fuel agreements before the next disaster, not after it.

Materials and sources

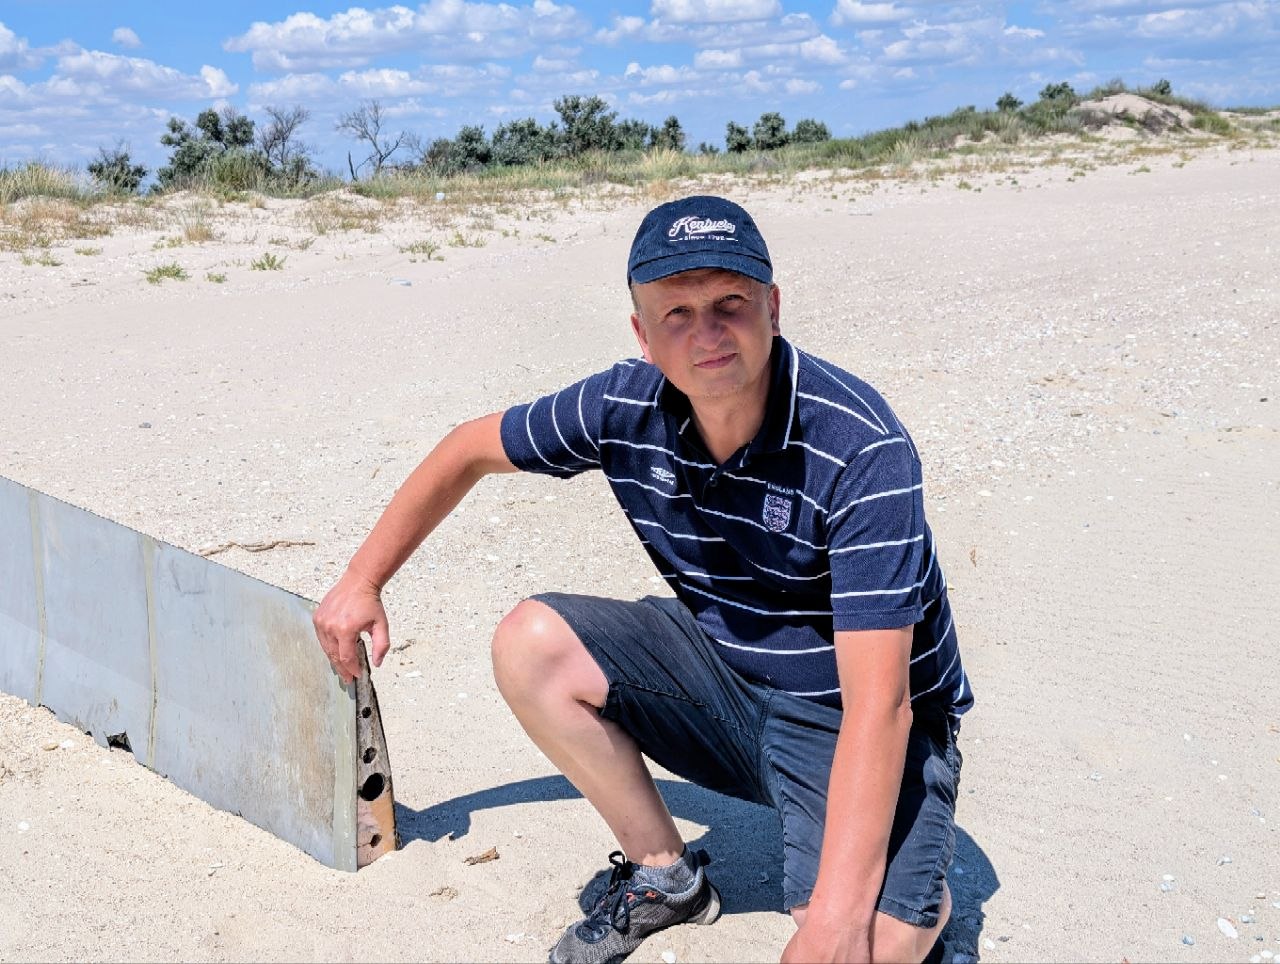
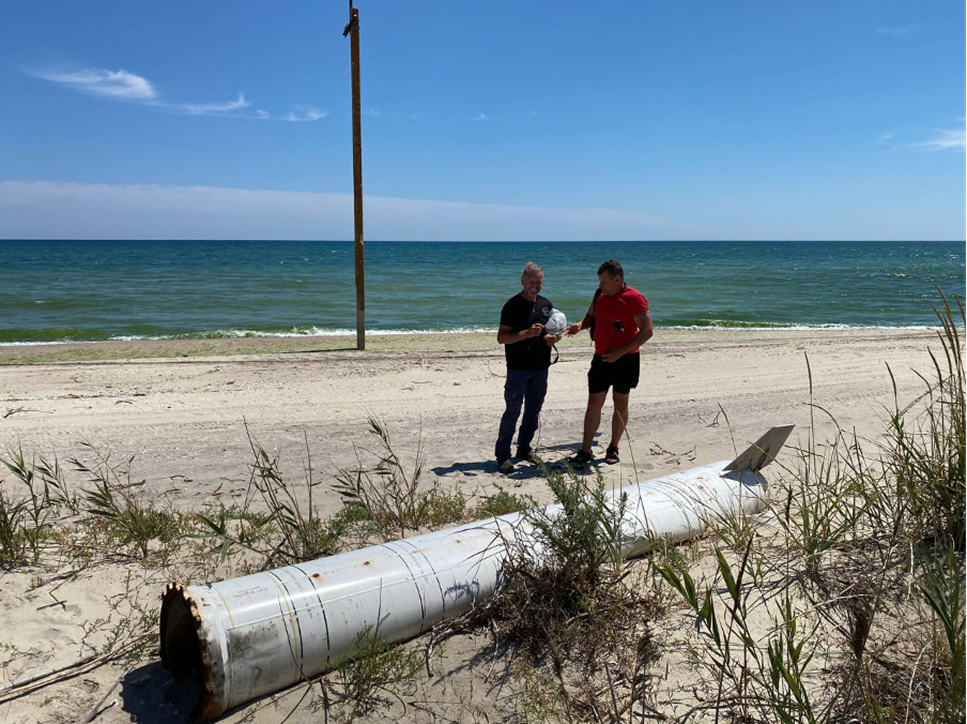
Field observations of heavy fuel oil in Odesa region:

Public documentation of the stern section of Volgoneft-239, January–March 2025:

Sunken sections, 2025–2026:

Quantities and international assessment:

Diesel agreement and shipping:

Scientific and hydrological assessments:

Map of environmental consequences:

Political context:
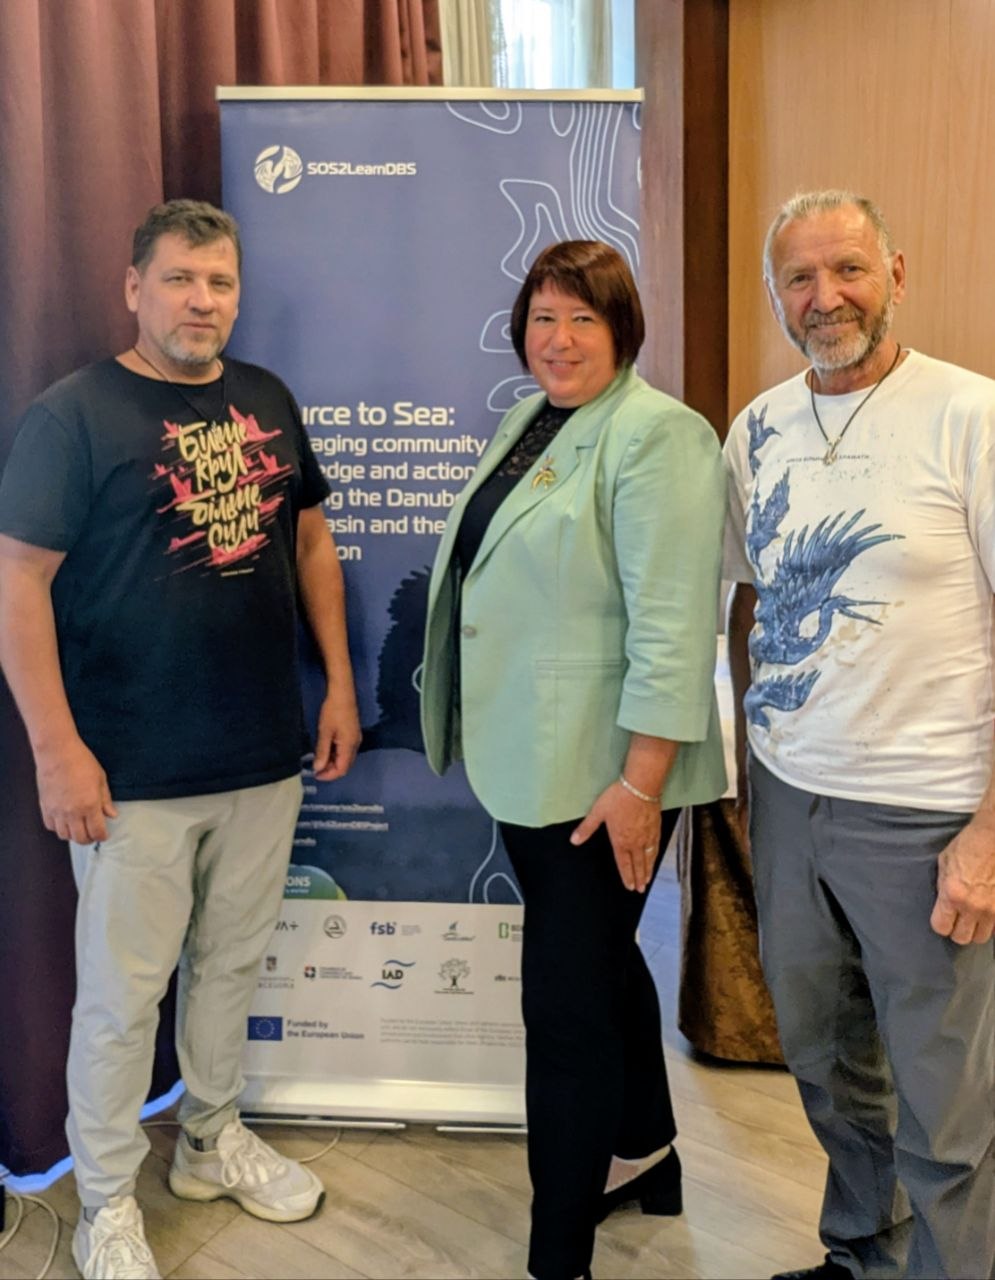
ByVladislav Balinsky

TuzlyResilience Project Launched: Communities and Environmentalists Unite to Strengthen the Resilience of the Tuzly Lagoons Coast

On 1 October 2026, the first meeting of participants in projects funded under the European SoS2LearnDBS initiative took place in Budapest. The new Ukrainian project TuzlyResilience was presented at the meeting. Over 30 months, it will work to strengthen the resilience of the coastline of Tuzly Lagoons National Nature Park and neighbouring communities.

The SoS2LearnDBS project is funded by the European Union.

What Does TuzlyResilience Involve?

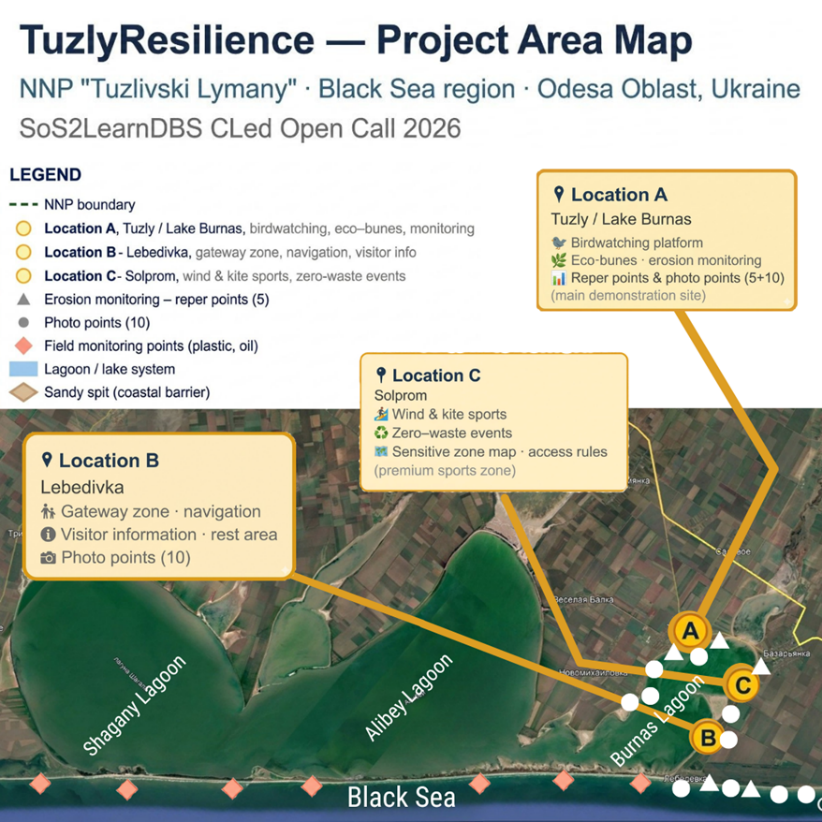
The project combines monitoring of coastal processes, nature-based protection against erosion, pollution prevention, managed recreation and active participation of local communities in decision-making. Specifically, a monitoring system comprising five reference points and ten photographic monitoring points will be established; eco-groynes will be tested at priority erosion sites; and a ‘Clean Season’ system and an oil pollution response protocol will be introduced. At three pilot locations — in the Tuzly/Lake Burnas, Lebedivka and Solprom areas — approaches to recreation compatible with nature conservation will be demonstrated.

Map showing the TuzlyResilience project area
Map of the TuzlyResilience project area. Presentation slide.

A distinctive feature of TuzlyResilience is that the community becomes not merely a participant, but a co-creator of solutions. Local residents will take part in monitoring the condition of the coast, nature conservation measures and defining the rules for using the pilot recreational sites.

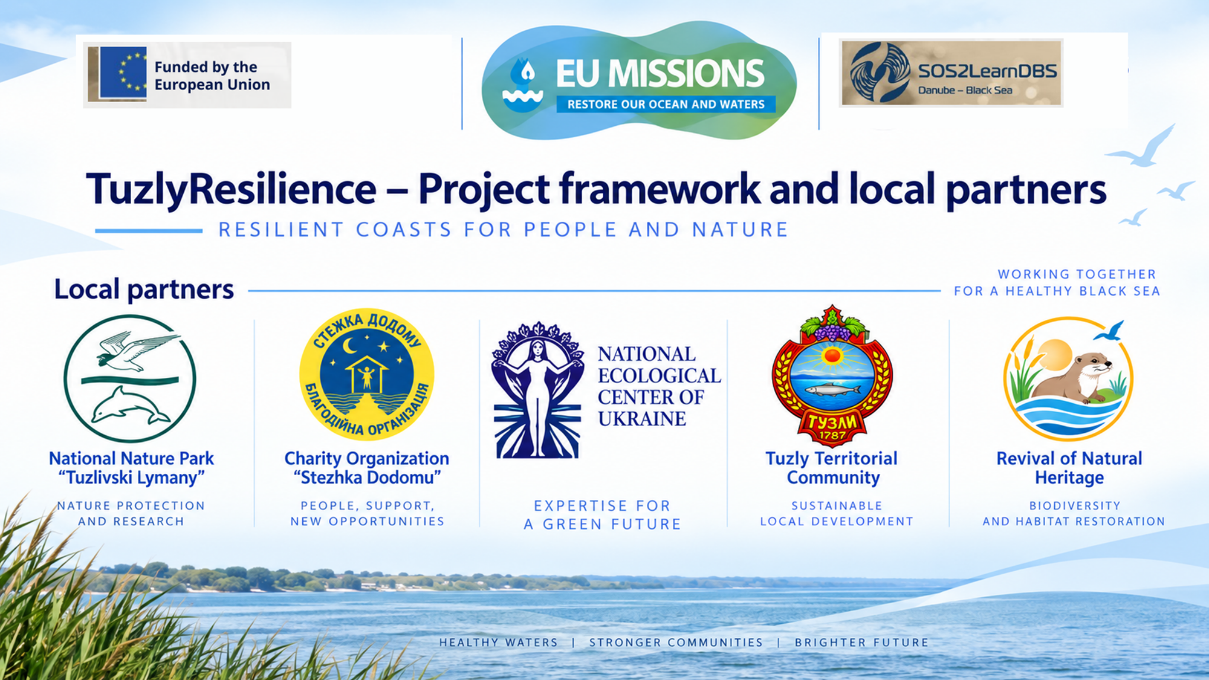
The project is implemented by a consortium of five Ukrainian organisations led by the National Ecological Centre of Ukraine (NECU): Tuzly Lagoons National Nature Park, the NGO Revival of Natural Heritage, the Stezhka Dodomu Charitable Foundation and the Finance Department of Tuzly Village Council.

Presentation slide showing the TuzlyResilience consortium partners
TuzlyResilience project partners. Presentation slide.

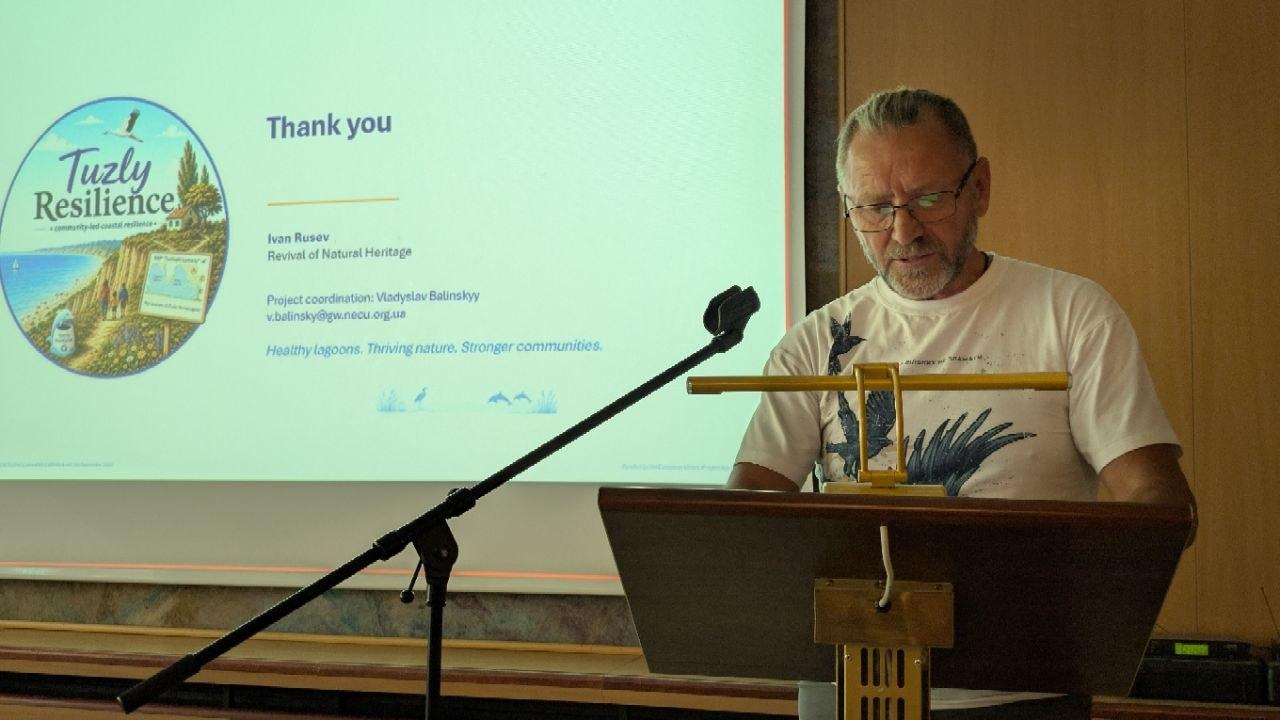
The project was presented by Ivan Rusev, head of the NGO Revival of Natural Heritage. He emphasised that the Tuzly Lagoons are a unique lagoon ecosystem with high biodiversity, important for birds, including pelicans and greater flamingos. At the same time, the area faces coastal erosion, marine litter and a need for safer, more responsible recreational use of the natural environment.

Ivan Rusev presenting TuzlyResilience in Budapest
Ivan Rusev presents the TuzlyResilience project in Budapest. Photo: Vladyslav Balinskyi.

The TuzlyResilience approach follows a sequence: baseline data → joint decision → pilot action → reassessment → replication. Thus, the project is intended not only to implement individual nature conservation measures, but also to develop a replicable model of coastal management that can be applied in other areas.

During the first six months, the plan includes launching the project and implementing safety measures, organising access to the area, establishing baseline monitoring points, jointly designing eco-groynes, holding the ‘Clean Season’ initiative and carrying out the first analysis of the results.

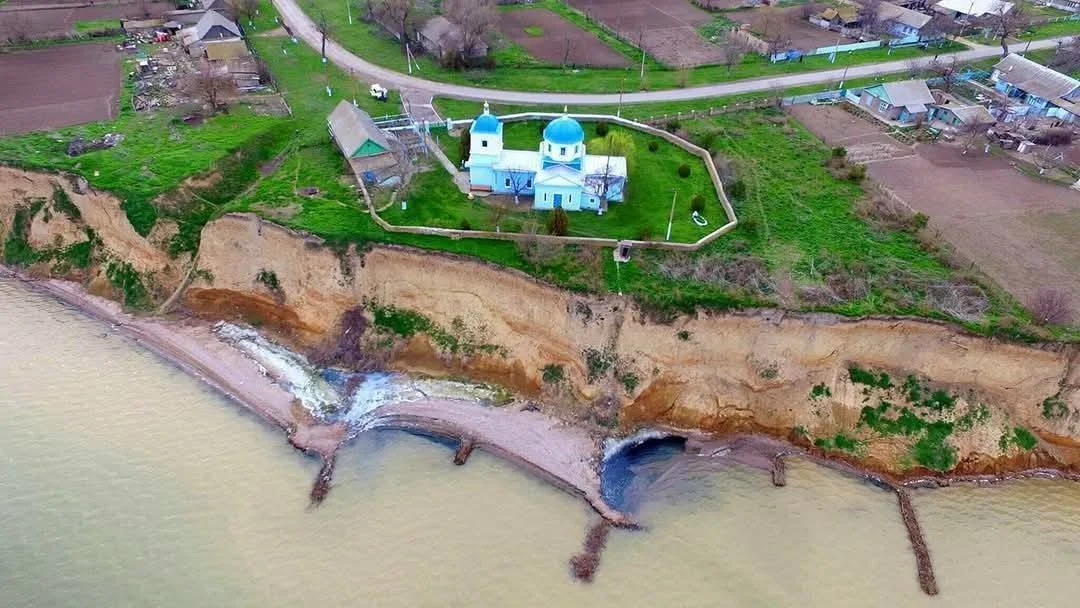
Nature-based coastal groynes in the village of Tuzly
A reference example of long-term nature-based coastal protection in the village of Tuzly: eco-friendly groynes built from locally available biomaterials near a nineteenth-century church. The structure has been functioning for almost a decade, promoting sediment accumulation and the natural formation of a beach. It provides local practical evidence supporting the suitability of an approach using eco-groynes developed specifically for this site. As part of TuzlyResilience, this approach will be designed, monitored and replicated at other sites. Photo: Ivan Rusev, Facebook.

SoS2LearnDBS: How Danube and Black Sea Communities Are Becoming Participants in the Restoration of Aquatic Ecosystems

TuzlyResilience is implemented within the SoS2LearnDBS project (Source to Sea: Leveraging Community Knowledge and Action for Restoring the Danube River Basin and the Black Sea Region), which aims to restore aquatic ecosystems in the Danube River Basin and Black Sea Region with the involvement of local communities. The project’s total budget is €12.5 million. SoS2LearnDBS is funded by the European Union under Horizon Europe and is linked to the EU Mission ‘Restore Our Ocean and Waters’.

The Danube is one of Europe’s major river systems and affects the condition of the Black Sea. Along with water from its basin, pollutants from agriculture, cities and industry reach the sea. This creates transboundary environmental problems and affects aquatic ecosystems and biodiversity.

For this reason, SoS2LearnDBS regards the Danube Basin and the Black Sea as an interconnected system — from the river’s headwaters to the seacoast.

The central idea of SoS2LearnDBS is that restoring aquatic ecosystems requires more than scientific research and technical solutions. People and organisations who live and work in these areas every day also play an important role.

The project therefore helps communities acquire knowledge and skills for working with aquatic ecosystems; participate in identifying environmental problems and priorities; jointly develop and implement practical solutions; obtain financial and technical support; assess the results of their actions; and share successful solutions with other areas.

In this way, the community is regarded not only as a recipient of information or a participant in consultations, but as one of the agents of restoration.

This is particularly important for the Black Sea Region, because environmental problems do not stop at administrative boundaries. The condition of river basins, deltas, lagoons and coastal areas is interconnected, while the effectiveness of many conservation measures depends on the involvement of local communities and authorities.

That is why SoS2LearnDBS aims to create not isolated, disconnected pilot projects, but a network of local actions that can be tested, improved, shared and integrated into long-term strategies for restoring aquatic ecosystems.

One of the key instruments of SoS2LearnDBS is cascade funding (Financial Support to Third Parties, FSTP). Open calls provide financial and technical support to local initiatives in which communities and organisations themselves participate in identifying environmental problems and in developing and implementing solutions. This system supports Community-Led Actions (CLed) — practical projects led by local participants — as well as Transition Agendas (TAg), roadmaps for long-term changes in aquatic ecosystem management.

SoS2LearnDBS began in September 2025. Its first phase focused on launching the project and preparing and holding calls for local initiatives. In 2026, following selection and the signing of agreements, implementation of Community-Led Actions — practical projects including Ukraine’s TuzlyResilience — began.

Funding acknowledgement banner with SoS2LearnDBS and EU logos
ByVladislav Balinsky

The Danube Is Running Low: Why Europe’s Great River Is Losing Water and What It Means for Ukraine

Water and Climate · Danube · Interview

For southern Ukraine, low water on the Danube is not a distant European anomaly. Ports, municipal water supplies, the Danube lakes and the resilience of the entire region to droughts and floods all depend on the river.

This summer, water levels on the middle Danube fell by about two metres, while discharge on some stretches dropped three- to fourfold. Ruslan Havryliuk explains why heat is only part of the story, how decades of regulation have changed the river, and why the consequences now extend far beyond navigation.

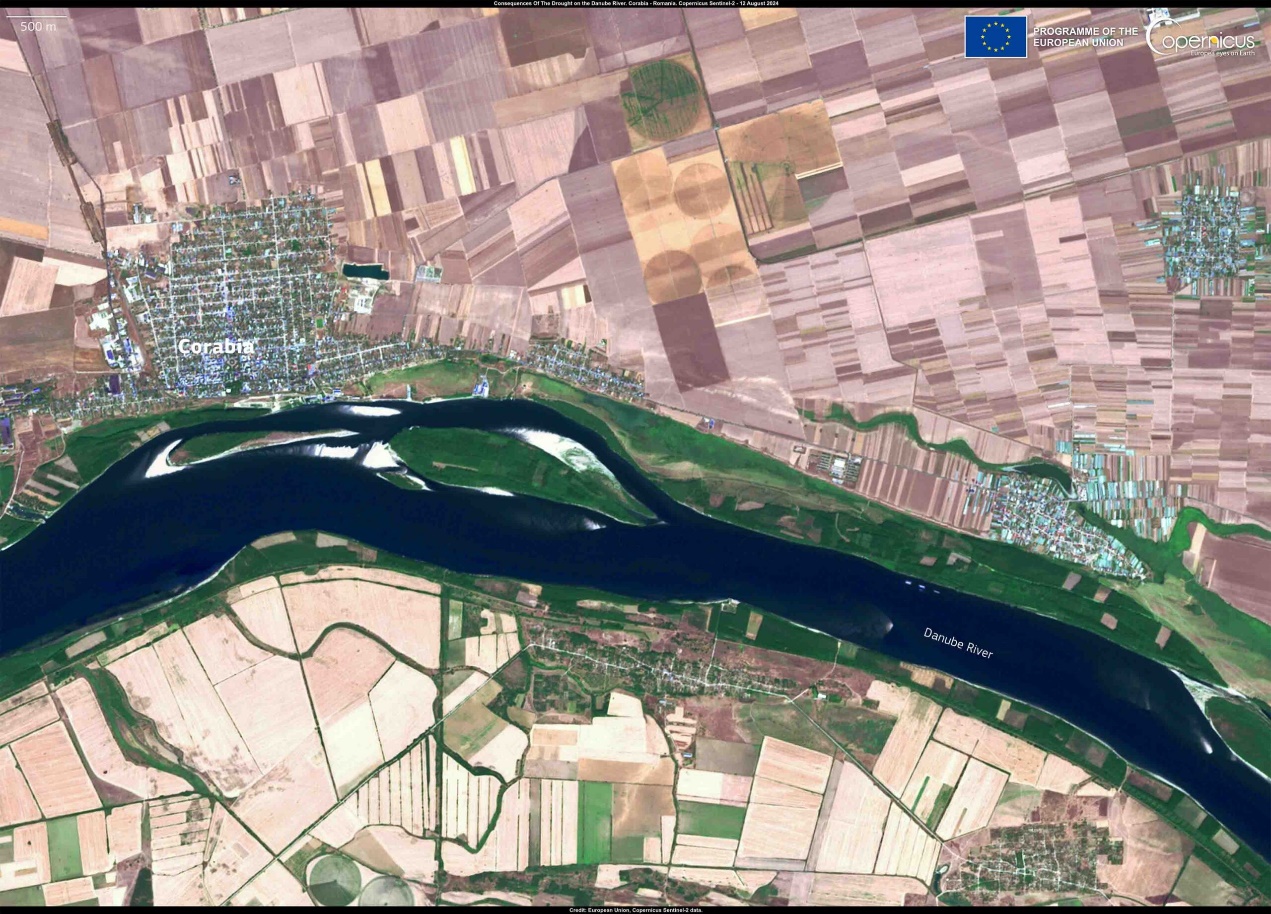
Satellite image of the Danube near Corabia, Romania, during low water
Photo 1. The Danube near Corabia, Romania, 12 August 2024. Effects of low river levels. Sentinel-2 / Copernicus EU satellite image.

Low water on the Danube can easily become a striking story about exposed banks and submerged artefacts. For Europe’s water system, however, the more important question is how much water levels and discharge have changed and what that means for infrastructure, ecosystems and the cities that depend on the river.

The Danube below normal: what the observations show

The Danube has become one of the main stories of recent weeks, although the warning signs were already there: extreme heat spread across Europe at the beginning of summer, including the Danube basin. The problem is not limited to this river. The same pattern is being observed on the Rhine, which flows into the North Sea, where one monitoring station recorded the lowest water level in the entire measurement record dating back to 1880.

No comparable absolute record has yet been officially declared for the Danube, but falling levels and discharge have already had a substantial impact on navigation and energy. This is critical for Hungary and Romania, whose nuclear power plants are located directly on the Danube and depend on its water availability.

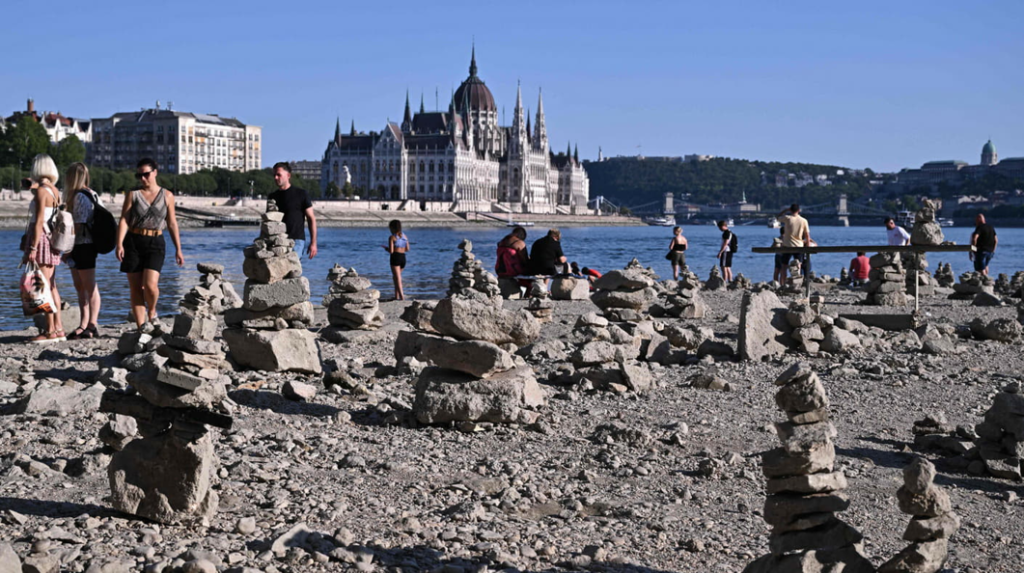
People walk across the exposed bed of the Danube in central Budapest
Photo 2. People walk across the exposed bed of the Danube in central Budapest. Photo: Attila Kisbenedek / AFP / East News.
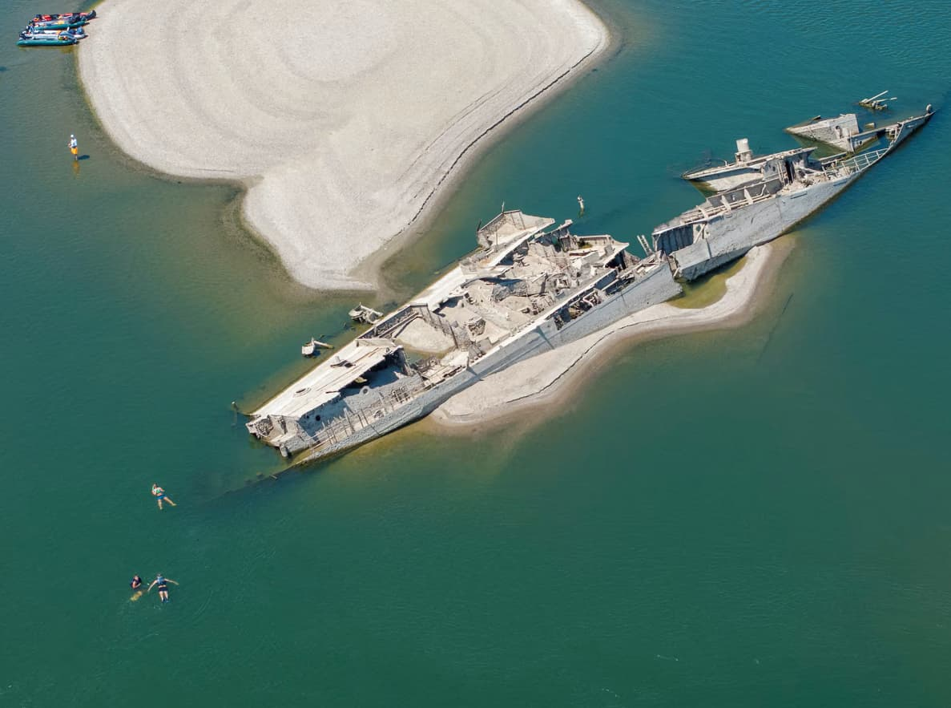
Low water on the Danube in Serbia exposes remains of a Nazi German fleet vessel
Photo 3. In Serbia, low water exposed the remains of a ship from Nazi Germany’s fleet. Photo: Reuters.

Measurements, not impressions

These are confirmed data. All countries in the Danube basin, including Ukraine, exchange hydrological observations through the open DanubeHIS portal, where changes in water level, temperature and discharge can be tracked over recent years.

The analysis shows that on the middle Danube, near Budapest, Belgrade and Novi Sad, the water level fell by about two metres. At the large transboundary Iron Gates reservoir on the Romanian-Serbian border, the level is regulated and changed by only a few centimetres because it is a managed system. Downstream, however, conditions deteriorate again: near Romania’s Cernavodă nuclear power plant, discharge is about 1,500 m³/s — extremely low. After the Siret and Prut rivers, which originate in the Ukrainian Carpathians, enter the Danube, discharge rises to around 2,000 m³/s. In spring it reached 8,000 m³/s, while the normal value is about 6,000 m³/s. That is a three- to fourfold reduction.

Because of this, the Romanian government is resorting to blasting rock and sinking old vessels to redirect the flow into a single channel. In Romania, the river divides into several branches, and one of them contains the Cernavodă nuclear power plant and the head of the Danube–Black Sea Canal. The aim is to raise the water level by just four centimetres, and even that requires enormous effort.

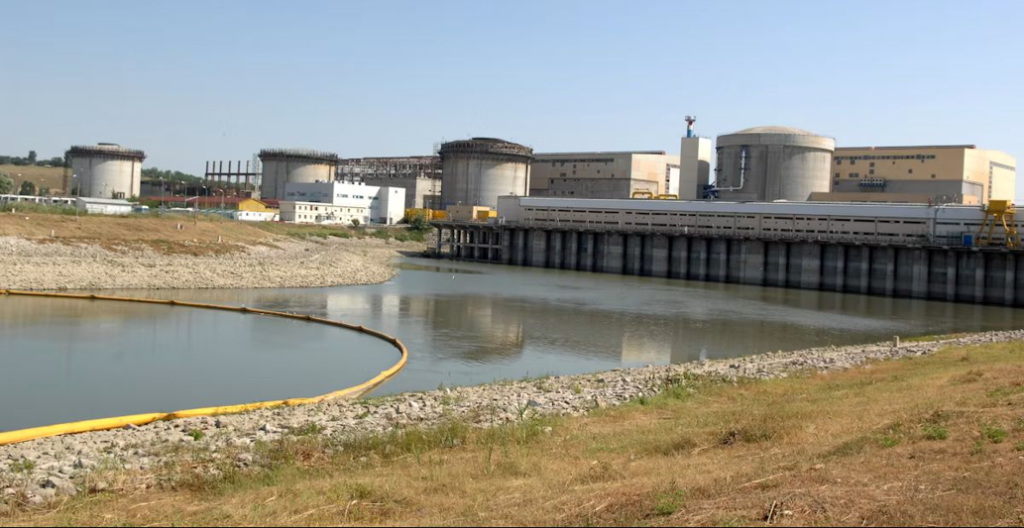
Cernavodă nuclear power plant on the Danube in Romania
Photo 4. The Cernavodă nuclear power plant on the Danube in Romania. Photo: Romania Journal.ro.

The current crisis is layered onto a long history of engineering intervention in the river. To understand why low water so quickly becomes a systemic problem, it is important to look not only at the weather but also at how people have altered the mechanisms by which water is stored and moved through the landscape.

A river reshaped by people for decades

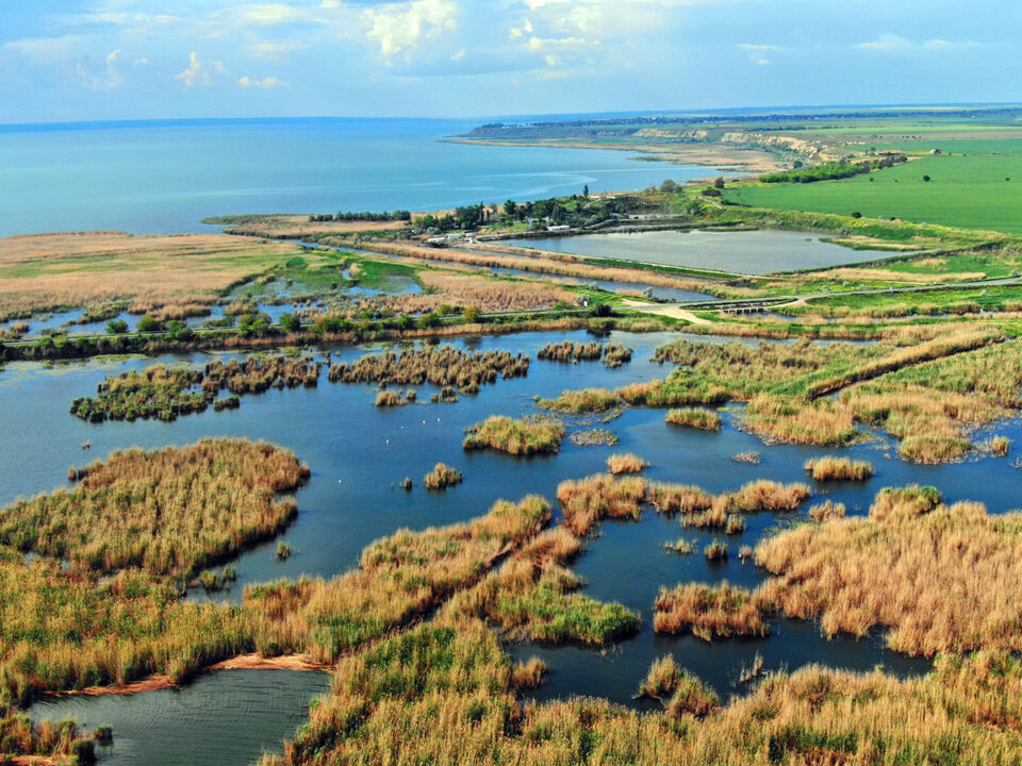
Before dams and reservoirs were built, the Danube was a free-flowing river that carried enormous amounts of sediment into the Black Sea. This is what allowed the unique Danube Delta to form and expand over roughly the past 150 years. Today, it is a protected area on both the Ukrainian and Romanian sides.

Lake Kuhurlui in the Danube Delta
Photo 5. Lake Kuhurlui in the Danube Delta. Photo: Maksym Yakovliev / Rewilding Ukraine.

Historically, the Danube has been a multipurpose artery for the countries of the region. It flows through or along the borders of ten countries, while its entire basin covers 19 states and more than 800,000 km² — an area larger than Ukraine. More than 80 million people live in the basin. For Ukraine, the Danube ports now play a critical role in trade and the economy under conditions of Russian aggression.

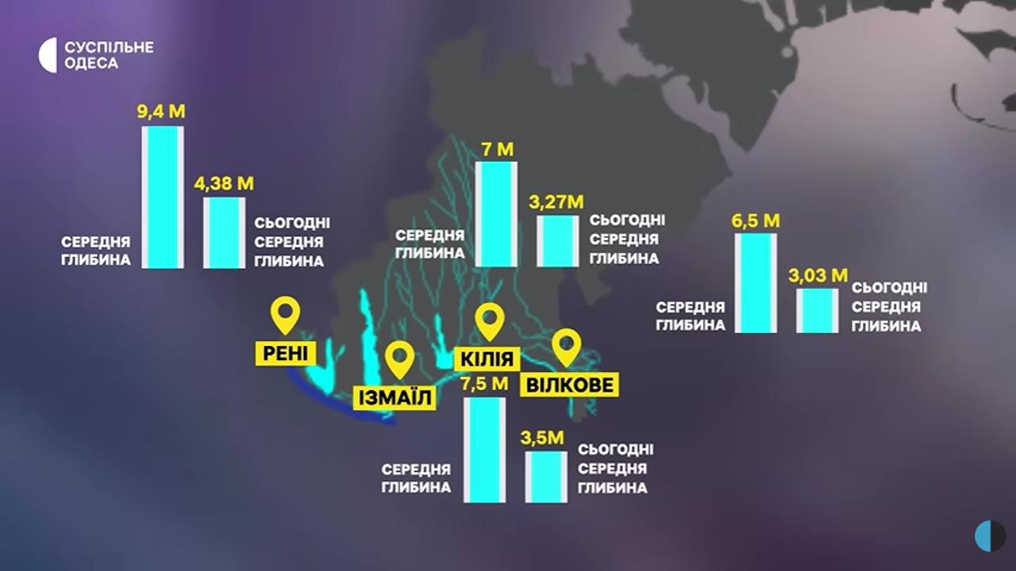
The groundwater component is equally important. Riverbank water intakes in the Danube valley, located tens to hundreds of metres from the river, supply drinking water to four European capitals on the Danube. For Vienna, the Danube is a backup source; for Belgrade, Budapest and Bratislava, it is a key source. The same applies in Ukraine: the largest Ukrainian cities on the Danube, Izmail and Reni, use this type of water-supply system, while Vylkove and Kiliia take water directly from the river.

For Ukraine, this discussion is especially practical. The Danube and the Dniester are tied to urban water supplies, port operations, lakes and wetlands in Odesa Oblast. A European hydrological anomaly therefore very quickly becomes a local water-security issue.

The Ukrainian dimension: the Danube, the Dniester and water for cities

The situation on the Dniester is no less critical. A large part of its basin lies in Ukraine; the river then passes through Moldova, which depends on Dniester water for more than half of its needs, before returning to Ukraine. Dniester water is what supplies Odesa’s water supply. When Mykolaiv’s Dnipro-based water supply was destroyed during the occupation of Kherson Oblast, volunteers brought water to the city from the Dniester.

Releases from the Dniester reservoir are currently being reduced on a regular basis, with the joint Ukrainian-Moldovan intergovernmental commission reviewing them almost every week. The headwaters of both the Danube system, through the Prut, Siret and Tysa, and the Dniester lie in the Ukrainian Carpathians, so both basins are experiencing a similar decline in water availability. This is a systemic rather than a local problem.

Infographic comparing average Danube depth with August 2026 values in Reni, Izmail, Kiliia and Vylkove
Photo 6. Comparison of the Danube’s average depth with values recorded in August 2026 in Reni, Izmail, Kiliia and Vylkove. Infographic: Suspilne Odesa.
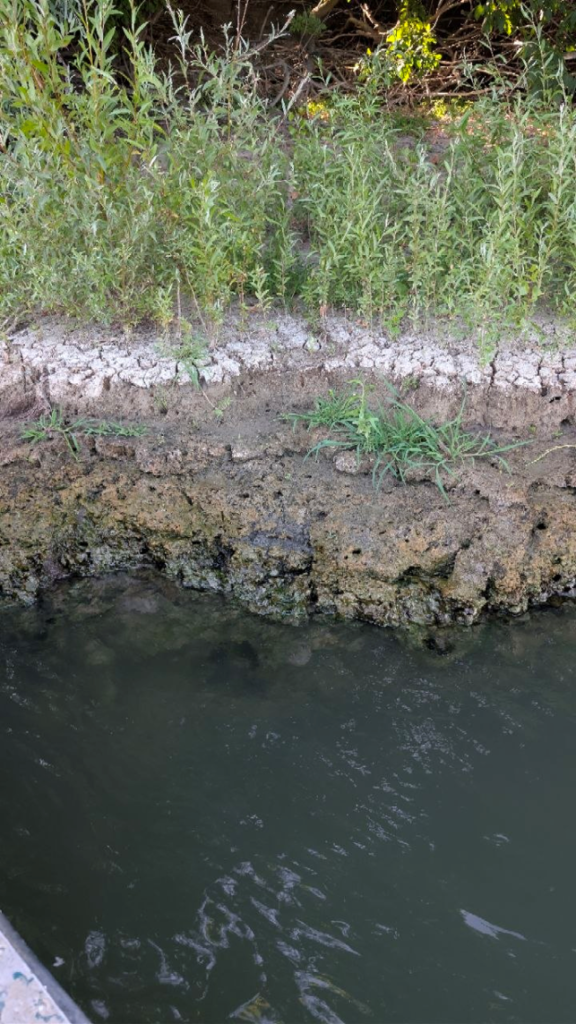
Falling Danube water levels in Odesa Oblast in August 2026
Photo 7. Falling Danube water levels in Odesa Oblast in August 2026. Photo: Vladyslav Balinskyi.

Heat triggers the crisis but does not fully explain it

The abnormal heat of mid- and late June, when temperatures in Western Europe reached 40°C and above, affected not only the traditionally hot southern countries but also northern France and southern Germany — the Black Forest region where the Danube begins. But this is only one factor in a long-term trend: droughts are becoming more frequent and more severe, and episodes like the current one are recurring ever more often — once roughly a decade in the past, now several times within a decade.

The reason is the declining ability of landscapes to retain water: small rivers disappear, groundwater levels fall, wetlands are lost and mountain forests are cut. A clear example is the Danube lakes, including Yalpuh, Ukraine’s largest freshwater lake. They no longer receive enough inflow from small rivers and now effectively depend on artificial replenishment with Danube water.

Agriculture also plays a role. Crops such as sunflower and maize require large amounts of moisture, so together with its harvest Ukraine is effectively exporting water as well. The government is currently trying to expand irrigation, but this does not solve the shortage and only increases pressure on water resources. The Kakhovka reservoir is another revealing example: agriculture was unprepared for the new conditions of restricted access to water. Large open water bodies also lose significant volumes through evaporation, which intensifies as temperatures rise.

Why rain does not restore the water balance

Rainfall will improve the situation but will not solve the underlying problem. The capacity of soils and the geological environment to retain moisture is declining because of mountain deforestation, the loss of wetlands and falling groundwater levels. As a result, the Danube now depends far more directly on precipitation than on the natural reserve that once maintained a stable minimum flow.

When rain falls, the water runs off rapidly across the surface and disappears just as quickly. The natural “buffer” that once fed the river between rainfall events is no longer there. It is the same process that dries out peatlands in Ukraine’s Polissia, eventually contributing to peat fires and smoke over Kyiv.

Low water stops being solely an environmental issue when infrastructure designed for a different hydrological regime begins to lose its safety margin.

When low water becomes an infrastructure risk

The clearest example is the nuclear power plants in Romania and Hungary, built 40–50 years ago on the assumption that Danube levels would remain stable. Unlike Ukrainian nuclear plants, they do not have cooling ponds: reactor cooling is once-through, directly from the river. Now, as water levels fall, the cooling-water intake pumps become exposed, creating a serious challenge whose consequences are difficult to predict.

Giving rivers back their freedom: what deregulation means

This is probably a matter of decades. Ukraine had long discussed gradually lowering the level of the Kakhovka reservoir, but in the end it happened instantly and catastrophically when Russian forces blew up the dam. About 18 km³ of water was released into the Black Sea in a short period, causing serious damage to the marine ecosystem.

Deregulation should begin with small steps: small rivers and abandoned hydraulic structures that no longer serve any economic function. At the same time, wetlands in river headwaters should be restored. Europe’s beaver population is a revealing example: once reduced to a handful of refuges, it has now recovered across the continent and naturally recreates wetland landscapes, retaining water wherever the animals build dams.

The European Union has officially adopted a course toward restoring free-flowing rivers: the goal is to restore 25,000 kilometres of free-flowing river stretches by 2030, while the EU Nature Restoration Law provides for the recovery of both terrestrial and aquatic ecosystems.

On the Danube itself, debate continues around the Iron Gates hydropower complex, the only structure on the river’s main channel comparable to Ukraine’s DniproHES. The dam traps sediment and silt, negatively affecting the lower Danube ecosystem, increasing erosion and reducing biodiversity while also decreasing the reservoir’s useful capacity. Fish passages are also being discussed, because any dam fragments a river ecosystem, as can be seen on the Southern Bug above and below the Oleksandrivka dam, or on the Dnipro, where reservoirs have replaced a river ecosystem with a lake-like one.

Further downstream, the problem is no longer measured only in centimetres of water level. Slower water dilutes pollution less effectively, changes conditions for benthic ecosystems and affects the quality of the water cities receive.

The lower Danube: slower flow, poorer water quality

The ecosystems of the lower Danube suffer most. The fact that water levels in the Ukrainian section have not yet fallen sharply is explained by its proximity to the Black Sea, but that also means seawater is being drawn upstream. A similar process is already clearly visible on the Southern Bug and the Dnipro, where a wedge of saline water is moving farther inland and increasing river salinity. Because the Danube’s discharge is much greater than the Dnipro’s, this has not yet been observed there, but the mechanism is possible in principle.

Lower flow velocity and discharge directly worsen water quality: the slower the current, the less effectively the river cleans itself and the less pollution is diluted. This is supported by studies of bottom sediments in the Iron Gates reservoir, where pollution from upstream has accumulated for decades, as well as by Ukrainian research on microplastics in lower-Danube sediments.

This directly affects water supply as well. Riverbank groundwater intakes in the Danube valley effectively use Danube water naturally filtered through alluvial sands. This is how water supply works in Bratislava, Budapest and Ukrainian Danube cities. Deteriorating water quality in the river therefore threatens the quality of the water these cities receive. As surface-water levels fall in Ukraine’s Danube lakes, water already has to be pumped into them artificially.

Zeleniy Lyst context. We have previously written about surface-water monitoring in the Danube, Dniester and Southern Bug basins and why river-water quality requires continuous laboratory monitoring.

Drought after flood: why this is not a contradiction

The total amount of precipitation in our river basins is not changing as much as its pattern. When intense rain falls, it is more likely to cause flooding because landscapes have lost the ability to store water in lakes, soils and wetlands. Without that capacity, rainfall turns immediately into a flood instead of gradually feeding the river.

The European Union has a separate directive on preparing for floods and high-water events, defining areas at risk and rules for managing them. The main principle is to free not only the river channel but the entire floodplain so that the river can overflow without damaging infrastructure. A telling example of the opposite approach is the Elenite resort, built in a river valley between Varna and Burgas in Bulgaria, which was completely washed away by a flood last year.

The response to low water cannot be reduced to a single large infrastructure project. In the logic described by Ruslan Havryliuk, resilience returns when landscapes regain their ability to retain water — from small rivers and wetlands to the way cities consume water.

What can be changed today

This is a shared responsibility that begins not with waiting for government action but with building public demand from below. There have already been some positive shifts: younger people generally have a stronger awareness of environmental value than earlier generations, and state river-basin management plans provide for specific measures. The main problem is funding: many Ukrainian cities still lack wastewater-treatment facilities and discharge untreated effluent into rivers.

Countries that joined the EU before Ukraine have gone through this process. For example, after joining the European Union in 2006, Romania spent tens of billions of euros implementing the Water Framework Directive and the Urban Waste Water Treatment Directive, whose requirements have only become stricter over time.

At the household-consumption level, the situation in Ukraine is gradually improving. In Kyiv, per-capita water use has fallen substantially over the years of independence, largely because of tariff policy, even though Ukrainian water tariffs remain lower than in EU countries. At the same time, southern Ukraine is already being forced to rebuild its water-supply system after the destruction of Dnipro water intakes that supplied Mykolaiv and Kryvyi Rih.

For southern Ukraine, low water on the Danube matters not only as a climate story. The Danube and Dniester are simultaneously natural systems, sources of water supply, transport arteries and the foundation of wetland ecosystems. When a landscape loses its ability to retain water, the same problem appears as drought, destructive flooding and deteriorating water quality.

A few rainy weeks may therefore raise river levels temporarily, but they will not restore the river’s natural reserve of resilience. Europe’s course toward restoring free-flowing rivers and wetlands points to a direction: fewer barriers in rivers, more room for floodplains and a greater capacity for landscapes to store water where it falls.

Sources and previous publication

  1. DanubeHIS — the Danube basin hydrological information system cited in the material.
  2. Ukrainian Radio — the broadcast on which Tetiana Herasymova based the material.
  3. National Ecological Centre of Ukraine — the previously published version of the material.
ByVladislav Balinsky

Grain, Oil or Fuel: What Was Really Burning at the Port of Taman

Environmental Monitoring · Satellite Analysis

Grain, oil or petroleum: what actually burned at the port of Taman. A spatial-dynamic analysis of the strike on the transport-and-fuel node of the Kerch Strait.

Vladyslav Balinskyi, editor-in-chief, «Zeleniy Lyst» · 8 August 2026

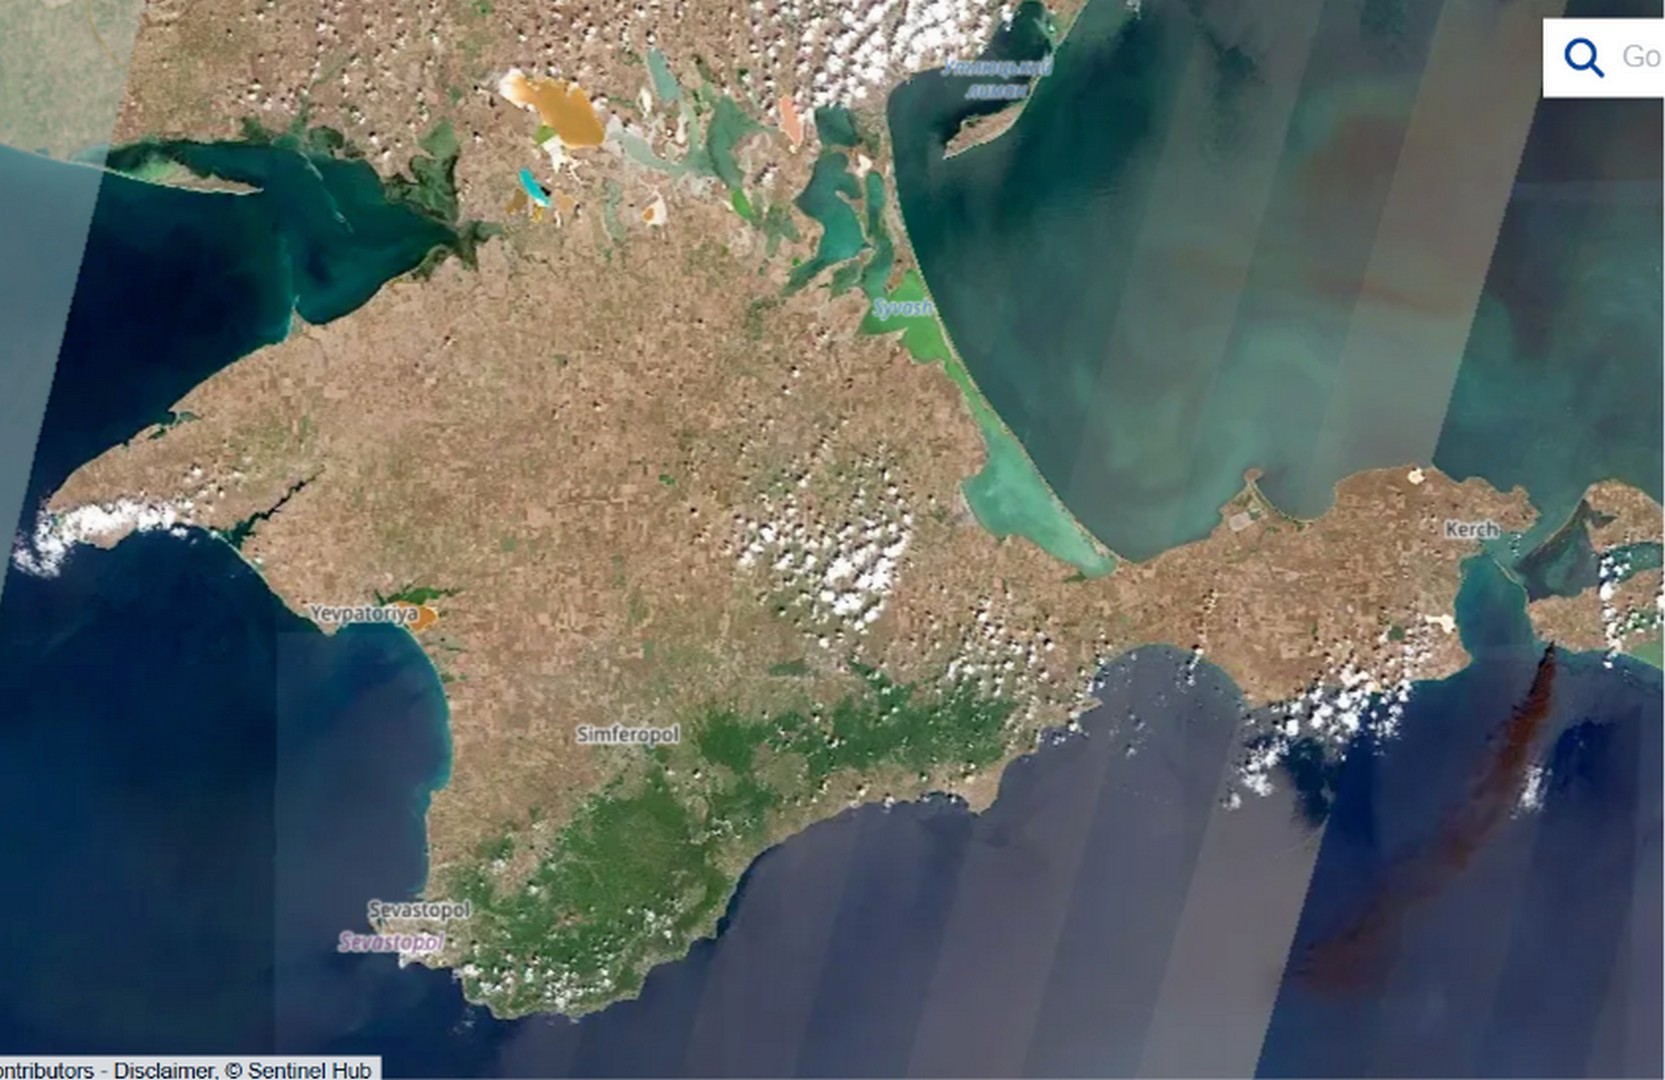
On 30 July 2026 Ukraine’s Defence Forces struck a transport-and-fuel node near the port of Taman that supplies fuel to the Russian grouping in the south. Despite the official Russian account of a “grain terminal” and the civilian label on the map, the satellite evidence points to burning petroleum products.

On the face of it the episode is clear: an enemy supply base destroyed. But once the parties’ statements are set against what the satellites actually show, the picture splits into three competing accounts of three different substances, and that discrepancy is where the real question lies. What burned on the shore of the Kerch Strait, and what the current is now carrying along the coast, we established not from statements but from instruments: backward drift modelling on Sentinel-1 and Sentinel-2 data, the thermal record from NASA FIRMS, and the actual wind regime from the strait’s weather stations.

Grain, oil or petroleum: concealing a military target

Once the scale of losses at the logistics hub became clear, the Russian side began contradicting itself. The transport prosecutor’s office reported damage to the port; an industry outlet insisted the affected facilities were “unrelated to petroleum transhipment”; and claims soon surfaced of a strike on a major grain terminal. Yet directly above the fire’s epicentre the satellite map carries an entirely civilian label: “oilseed processing plant.” Three accounts, three substances, and at least one of them is untrue.

Sentinel-2: intact Tamanneftegaz tank farm and black smoke above the facility labelled as an oilseed processing plant
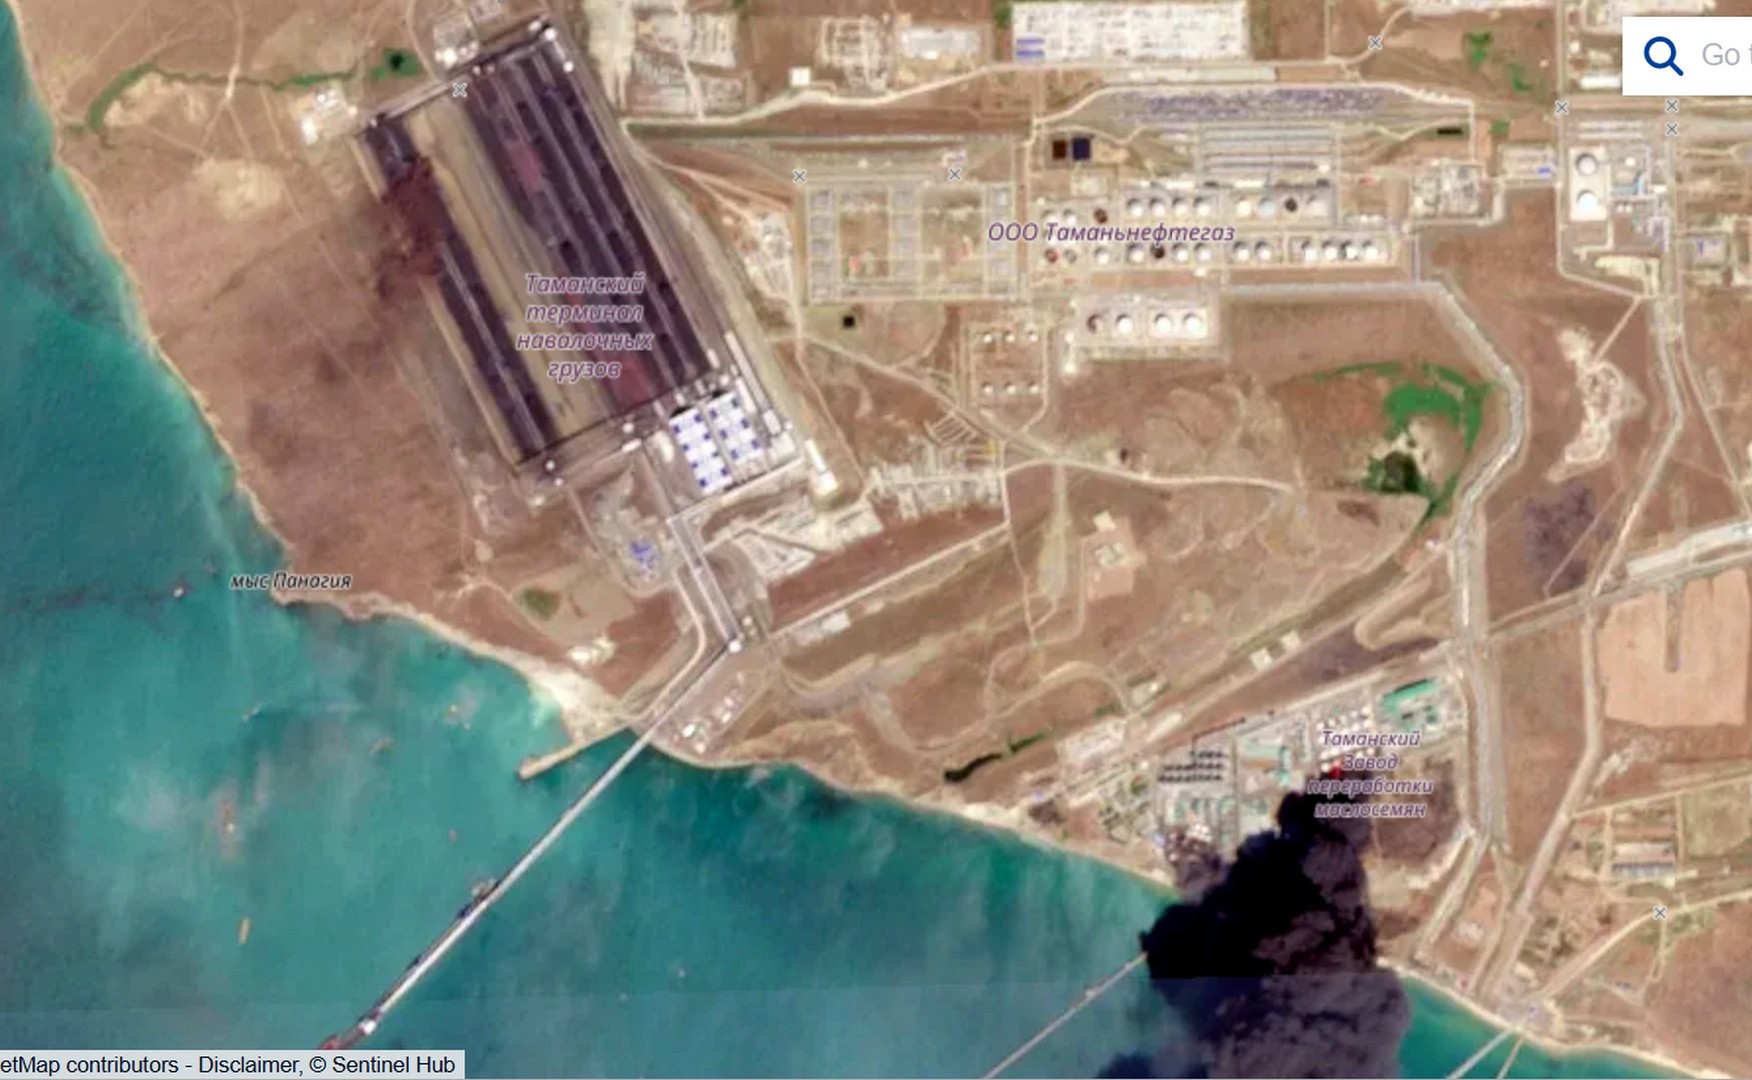
Photo 4. Sentinel-2, 31 July 2026. The Tamanneftegaz tank farm is intact, while a black smoke column rises over the facility labelled as an oilseed processing plant. Source: Sentinel Hub / OpenStreetMap.

The grain framing is not accidental: it lets Russia invoke global food security and court international outrage. In this case, however, the substance is fuel, and that can be shown step by step.

Smoke does not lie: fuel that burned without pause

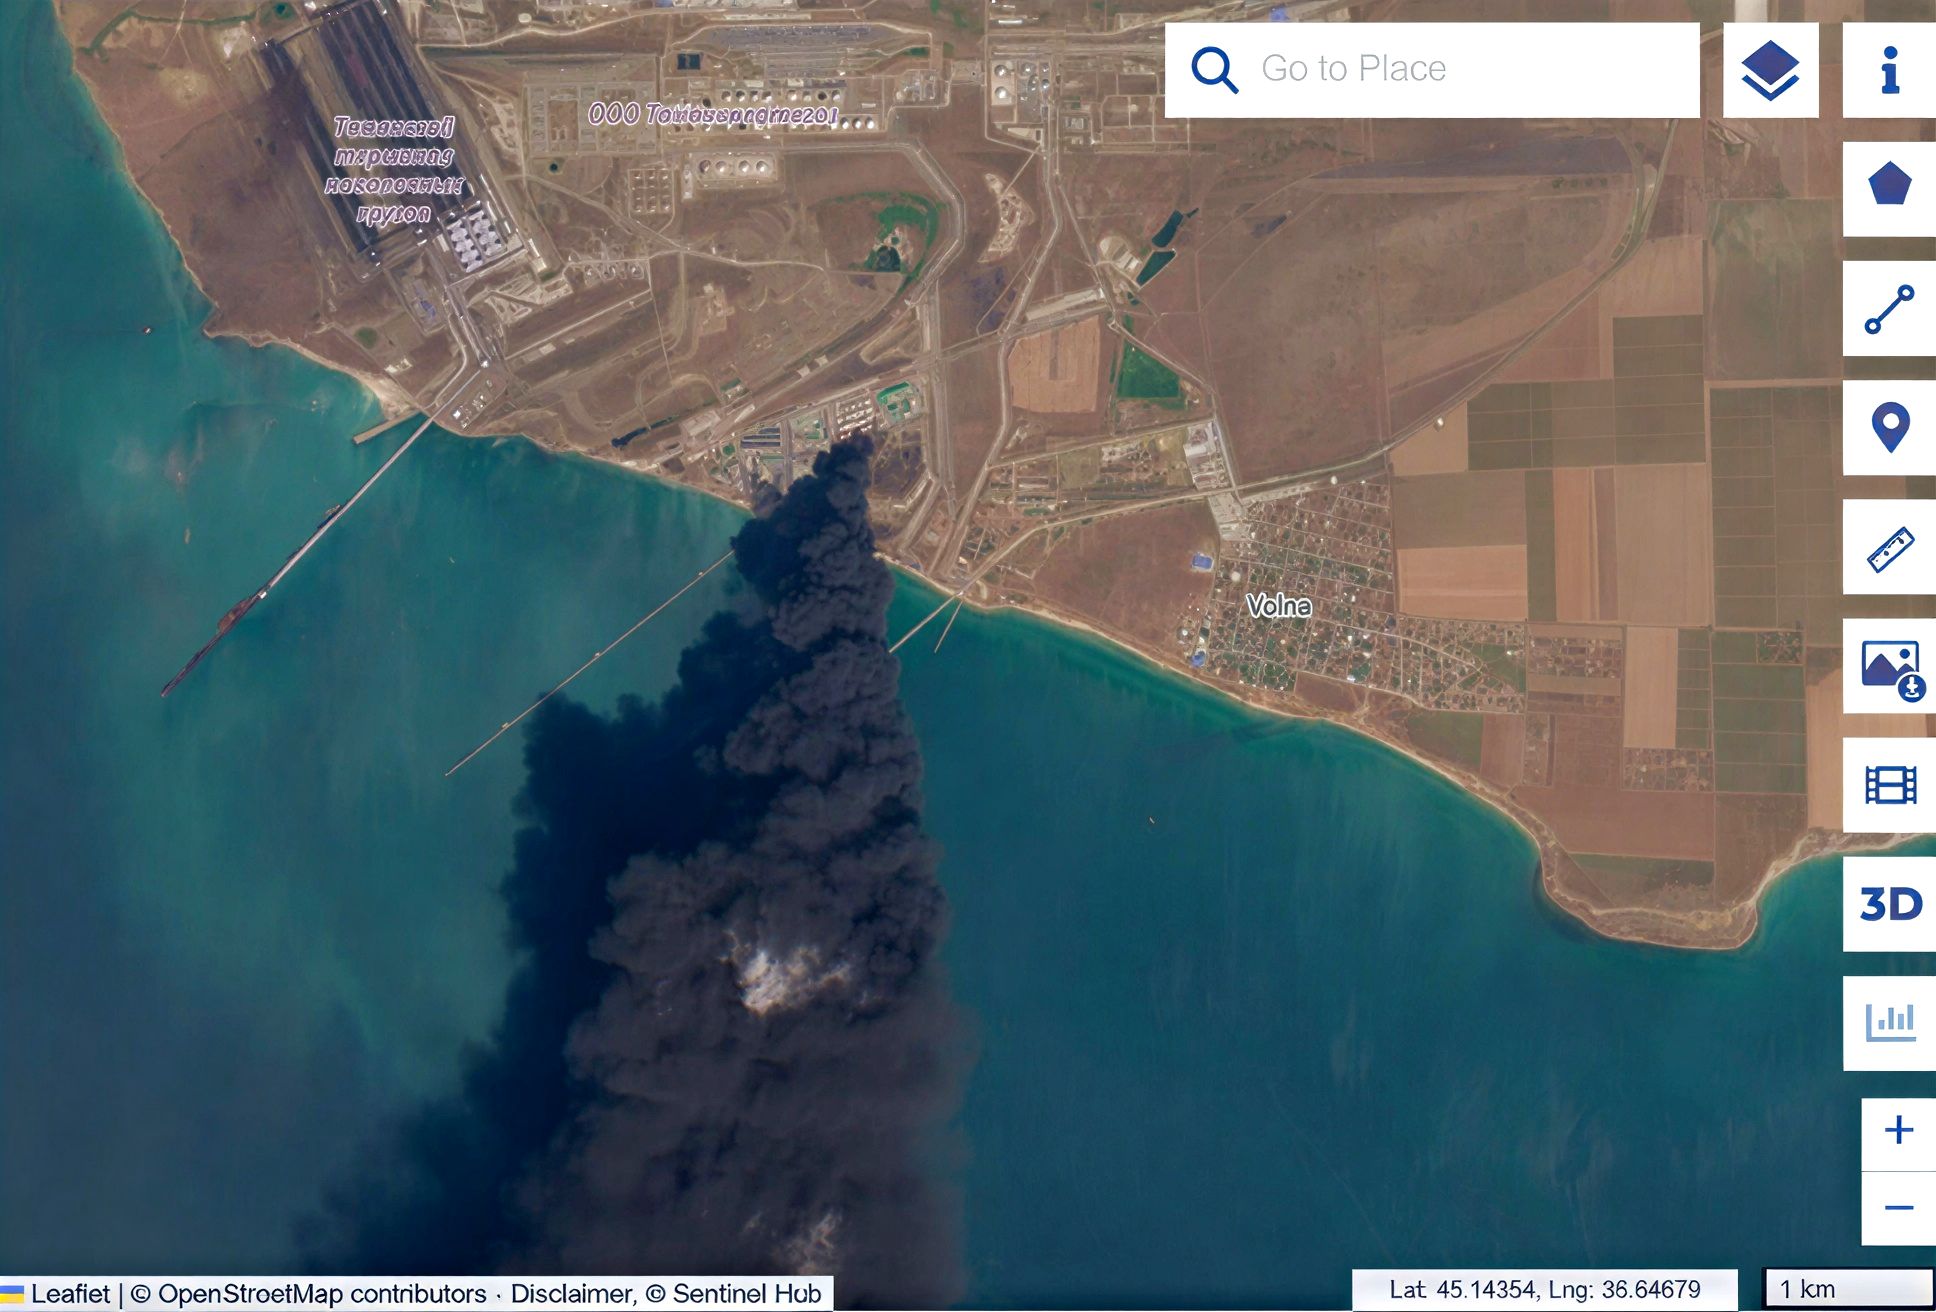
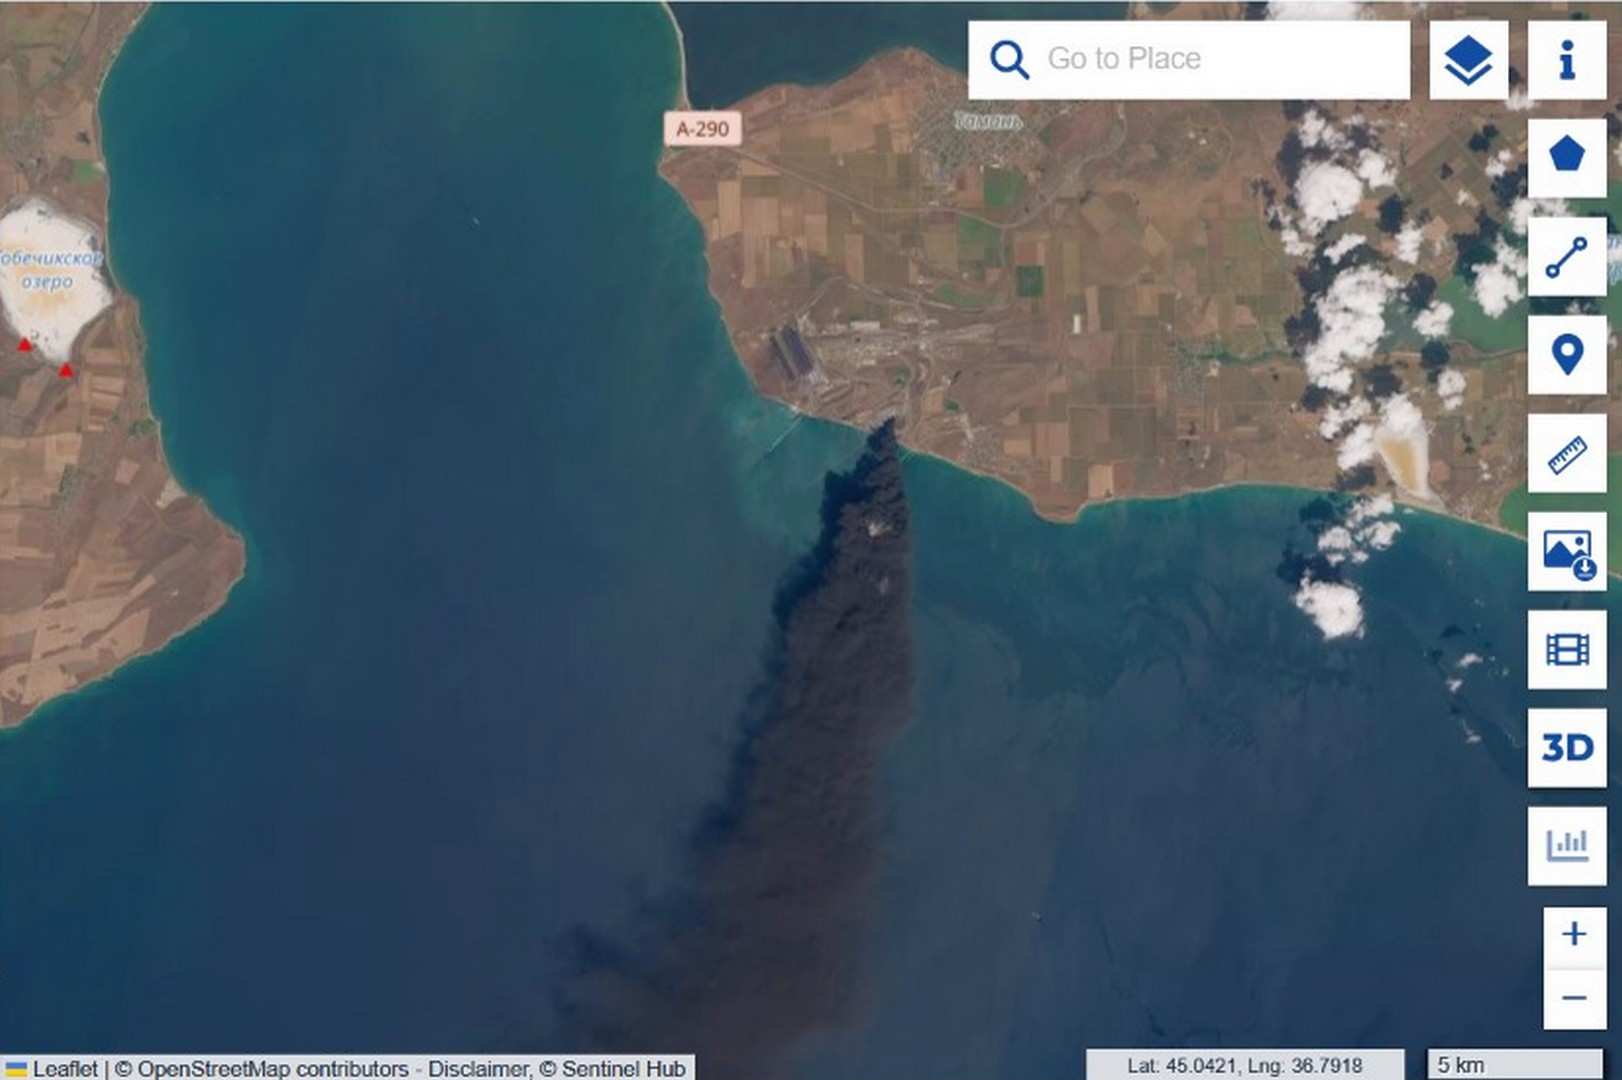
The Sentinel-2 optical image shows a dense, uniformly black, oily smoke column carried out to sea, with a visible plume length of roughly 100 kilometres on the 31 July frame by our own measurement. From there it is a matter of elimination. Vegetable oil does not ignite from a strike: its flash point exceeds 300 °C, and the smoke would in any case be pale. Hexane, the solvent used in oil extraction, flares black but burns off in minutes, whereas this fire ran for days. Biomass such as husk and meal burns unevenly, with a pale margin, not as an even black column. Once all three are ruled out, what remains is a steady, black, multi-day fire, and that is the signature of a stable hydrocarbon.

Sentinel-2: fire epicentre at Taman port with a dense black smoke plume
Photo 1. Sentinel-2 L1C, 31 July 2026. The fire epicentre. Uniform black smoke is the signature of burning petroleum products. Source: Sentinel Hub.
Sentinel-2 wide view of the black smoke plume extending from Taman port over the sea
Sentinel-2 regional view of smoke transport across the Kerch Strait area
Sentinel-2 with a roughly 111 km² pollution bounding polygon and a roughly 100 km smoke plume measurement
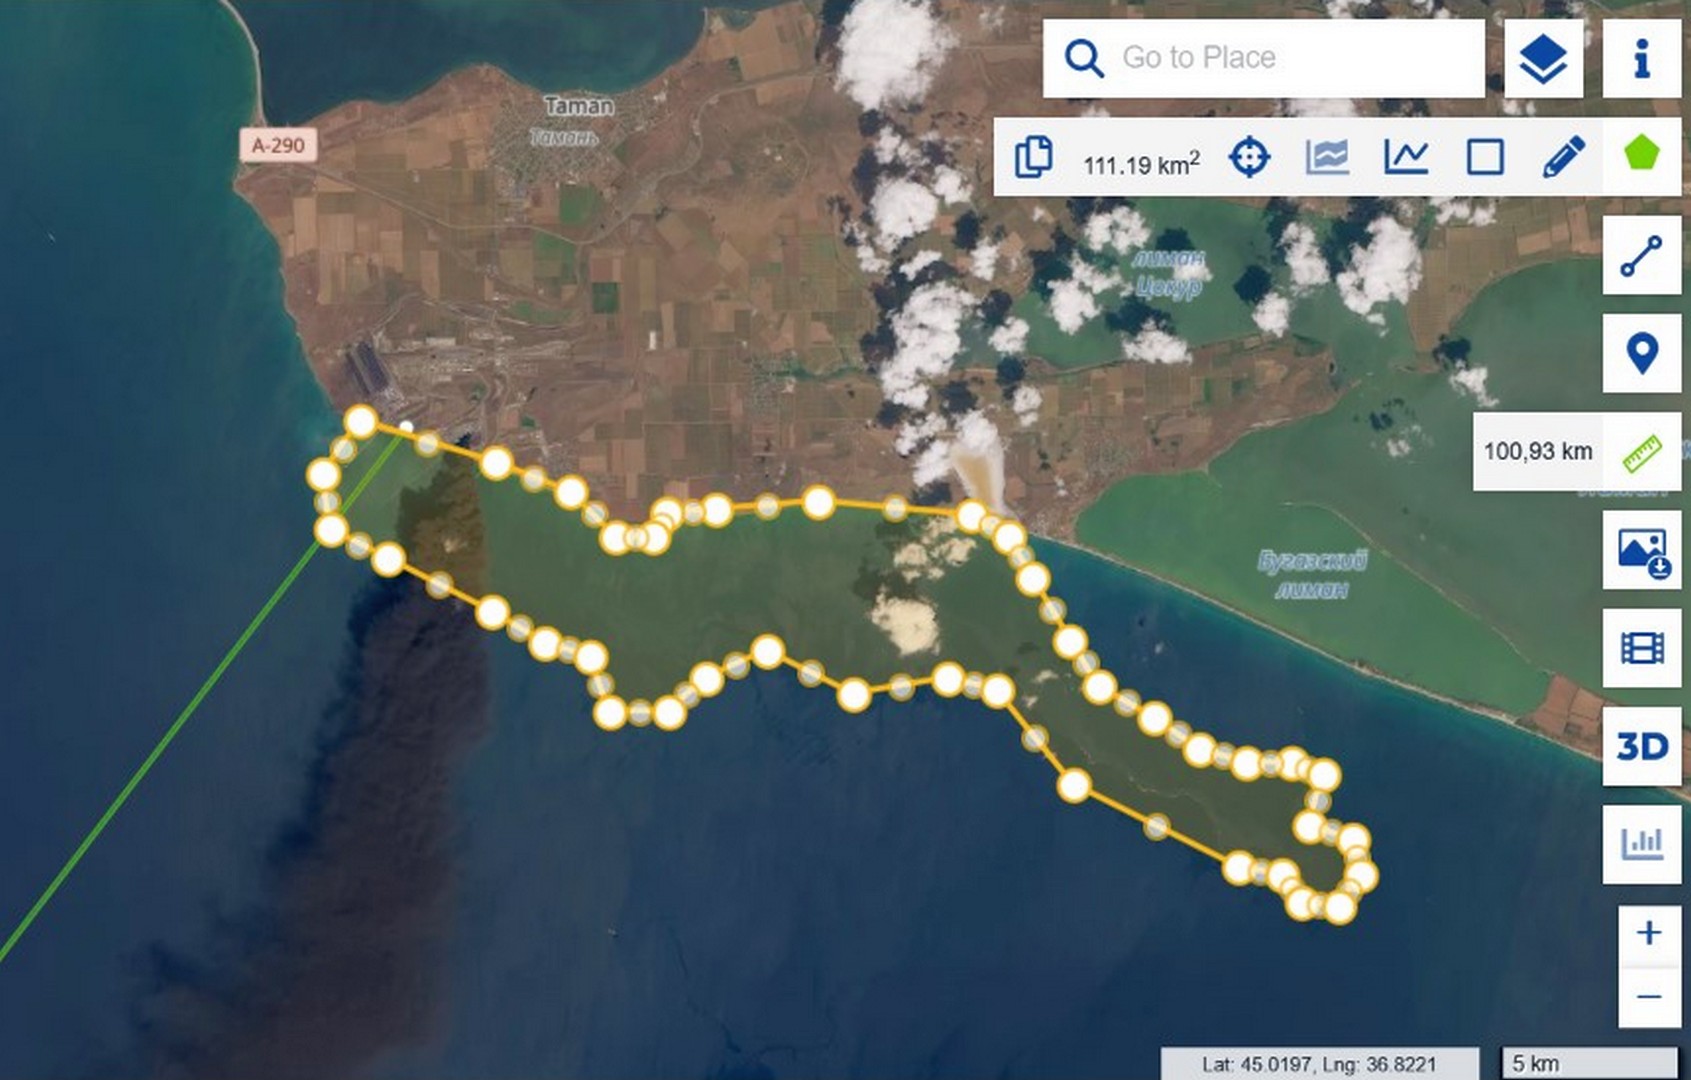
Photos 2, 3, 5. Sentinel-2, 31 July 2026. Wide and regional views of the smoke; a polygon gives the bounding area of the early contamination (about 111 km²), and a ruler gives the plume length (about 100 km). Source: Sentinel Hub.

Oil does not burn: verified across eight cases

There is empirical support as well. «Zeleniy Lyst» has systematically documented strikes on oil infrastructure, and over two years there have been at least eight hits on vegetable-oil tanks in the ports of Pivdennyi and Chornomorsk. In none of them did the oil sustain a lasting black flame: it leaked, spread as a film, occasionally set nearby structures alight, but never produced an oily black column lasting days. We compiled the comparison in our satellite analysis of Operation Molochka.

Thermal signal: a fire that did not go out

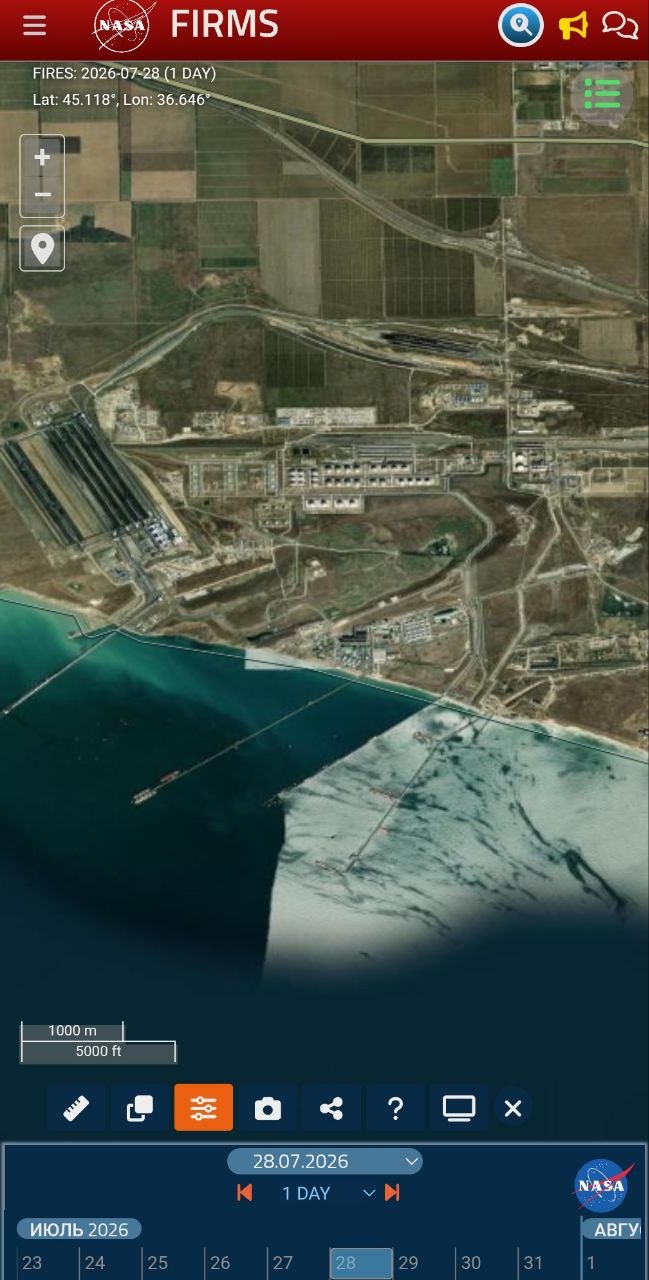
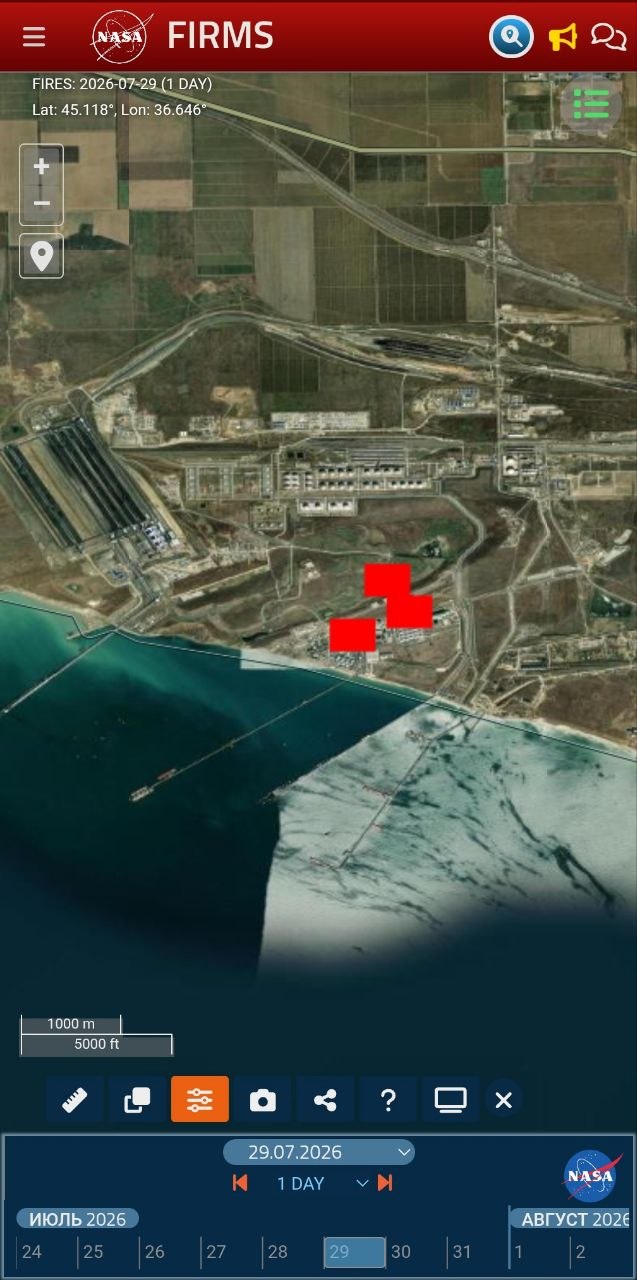
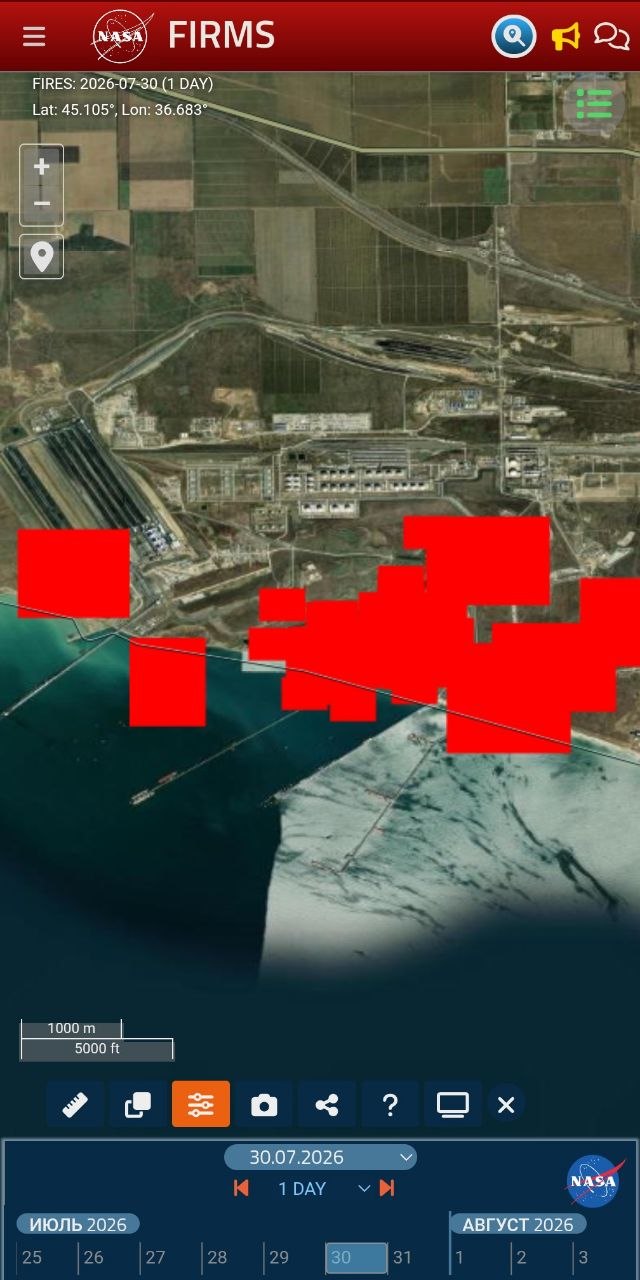
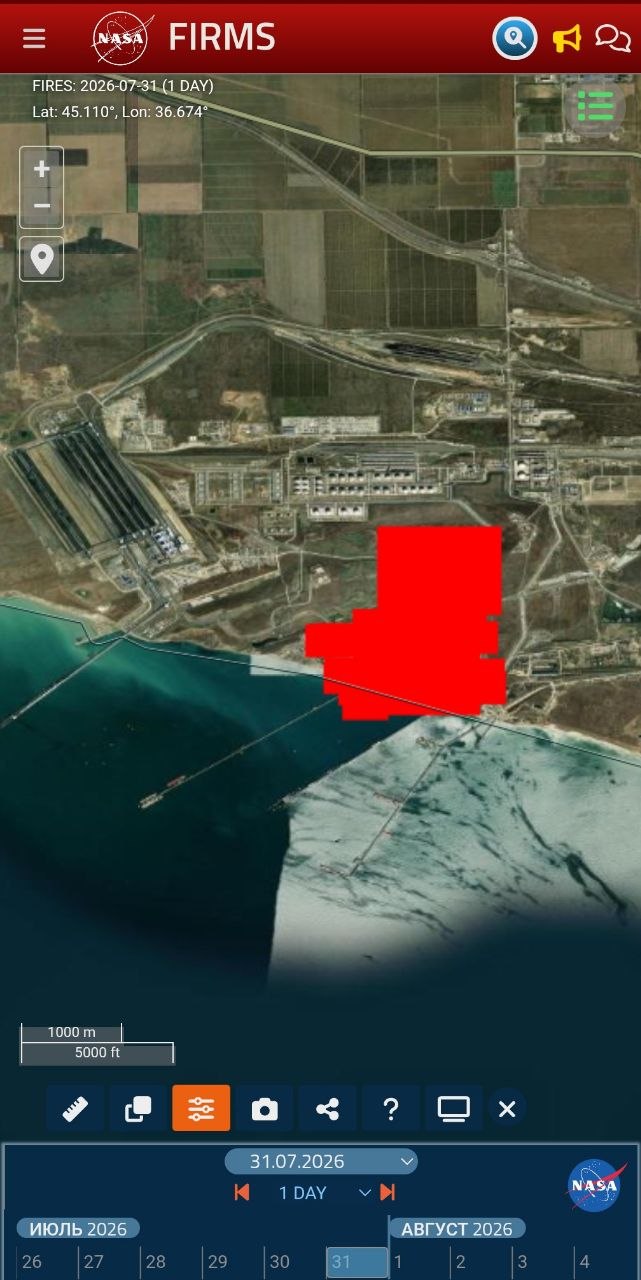
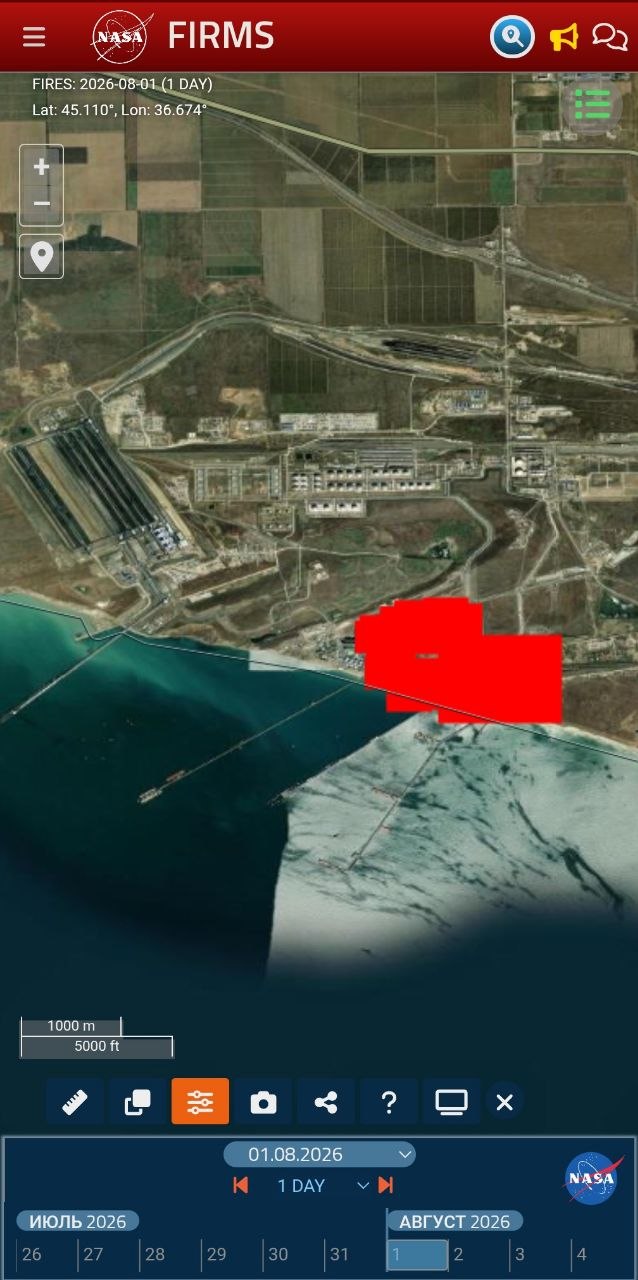
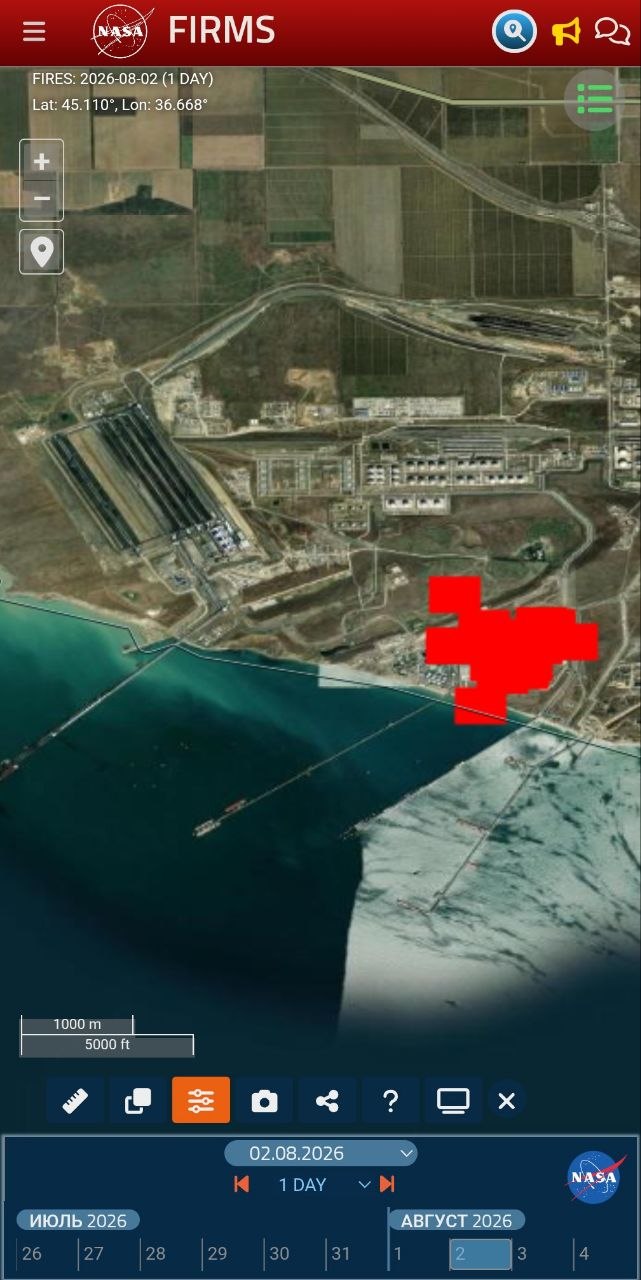
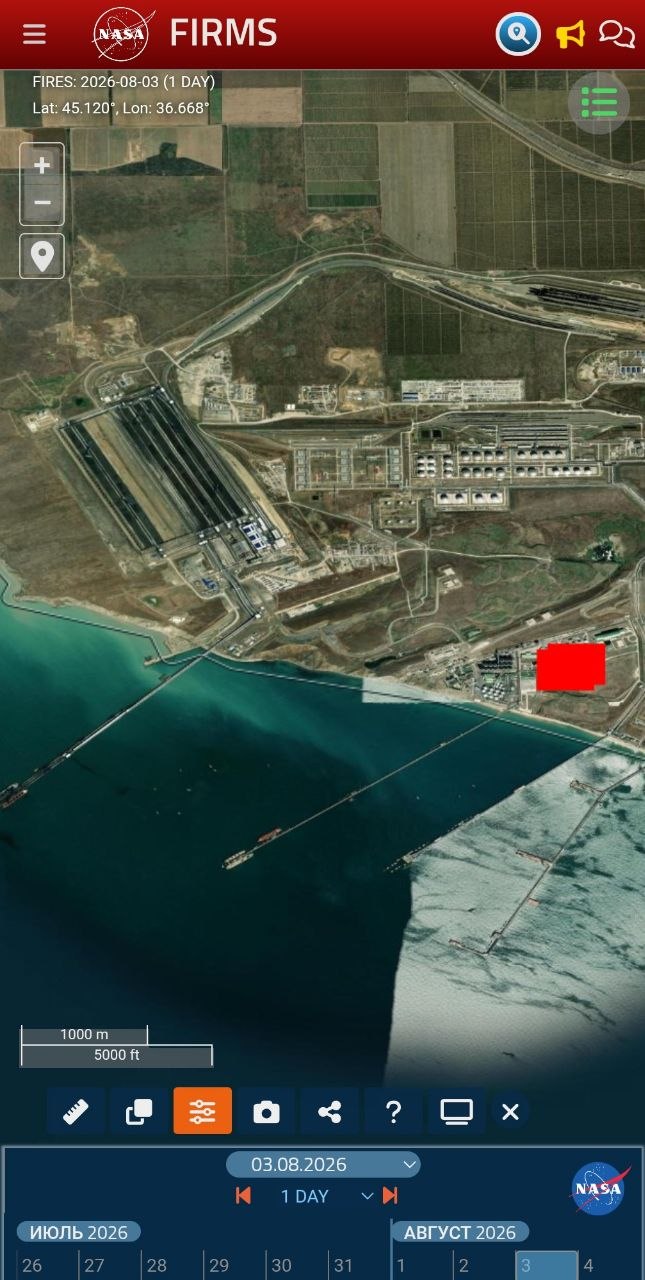
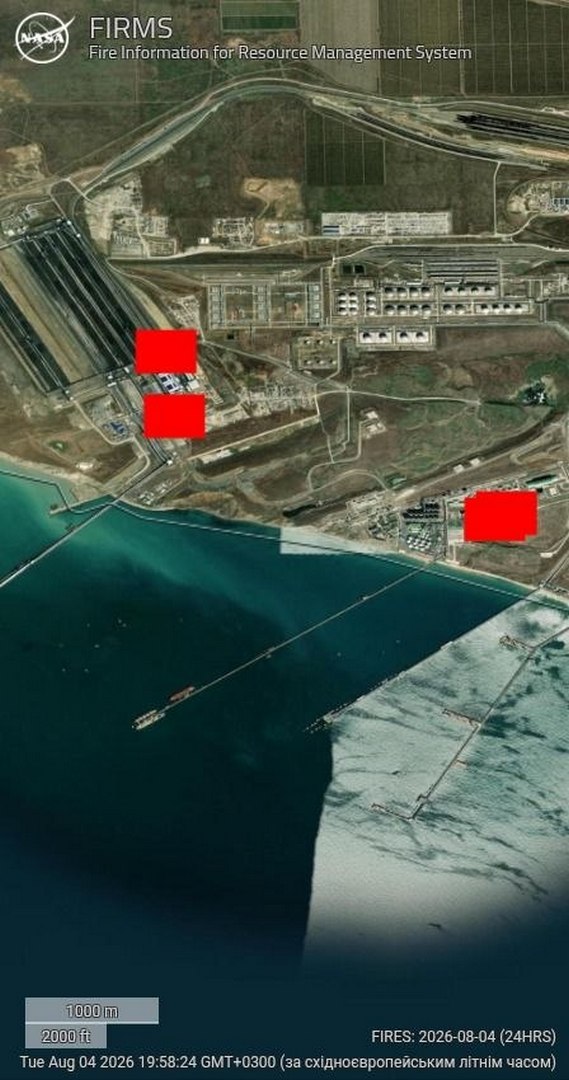
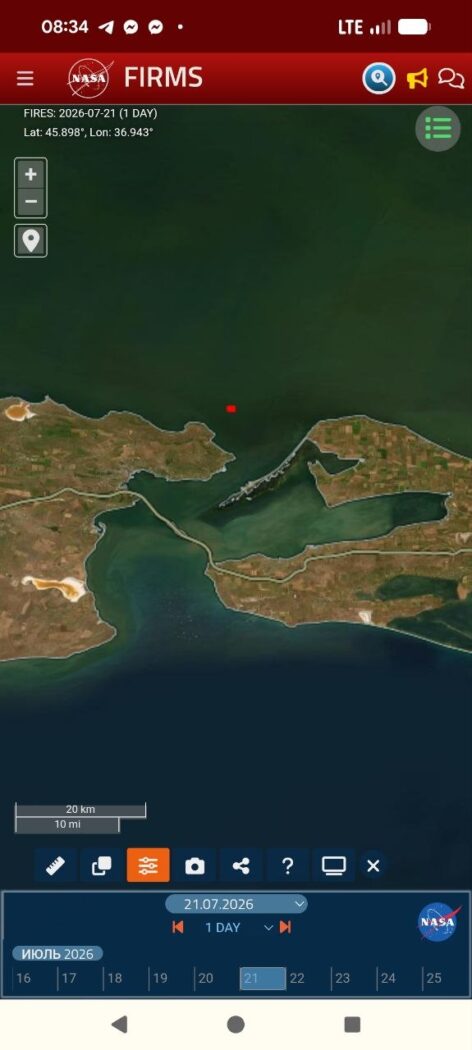
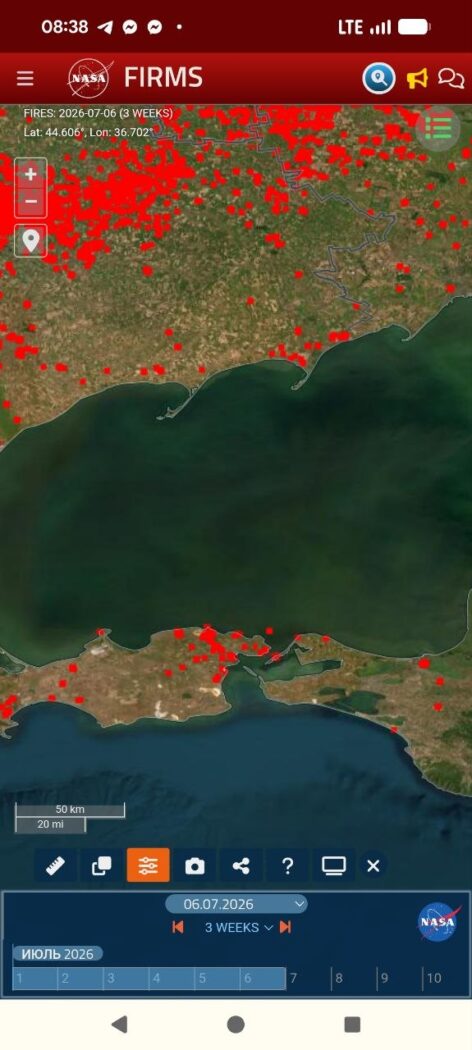
FIRMS records heat independently of smoke, and the picture from 28 July to 4 August is unambiguous. On 28 July it is clear, the pre-strike baseline. On the 29th isolated background detections appear, and on the 30th a dense cluster flares on the day of the strike. From 31 July through 2 August the signal holds at full strength; on 3 August the periphery burns down but the hotspot at the facility itself does not disappear, and on the 4th fresh detections appear around it. The essential point is that the plant’s own location burned without interruption throughout.

NASA FIRMS, 28 July 2026: pre-strike baseline
NASA FIRMS, 29 July 2026: isolated background thermal detections
NASA FIRMS, 30 July 2026: dense thermal anomaly cluster on the day of the strike
NASA FIRMS, 31 July 2026: strong thermal signal after the strike
NASA FIRMS, 1 August 2026: persistent thermal signal at the site
NASA FIRMS, 2 August 2026: continued persistent thermal signal
NASA FIRMS, 3 August 2026: site hotspot remaining after the periphery weakened
NASA FIRMS, 4 August 2026: new thermal detections around the hotspot
Photos 6–13. NASA FIRMS, 28 July — 4 August 2026. A continuous fire at the site: the hotspot is recorded every day, only the coverage area changes. The scatter of coordinates falls within FIRMS resolution (pixel about 375 m). Source: NASA FIRMS.

Vegetable oil does not burn for six days. Hexane burns off in minutes. Meal does not radiate heat like this. This is fuel, and it kept burning.

A civilian label on a military node

When a site is listed on every map as an oilseed processing plant, yet its hotspot burns without pause for six days and throws a hundred-kilometre black plume, this is no longer coincidence but tactic. Military logistics are hidden behind a civilian label so that a strike can be recast as a hit on “civilian infrastructure” or “on grain.” Two readings are possible and both point the same way: either the occupiers kept fuel under the guise of a civilian enterprise, using it as a shield, or it genuinely was an oil mill into which petroleum was piped for army needs. Either way this is the deliberate use of a civilian object for military purposes, itself a breach of international humanitarian law by the party that does it.

The cause should be named plainly. Russia is waging a war of destruction against Ukraine, and Ukraine, in defending itself, is entitled to strike the adversary’s military-logistics objects. The aggressor state has deliberately turned occupied Crimea and the Taman shore into a military-logistics complex, a fuel-supply node for the offensive, and placed it on the shore of a semi-enclosed sea, without secondary containment or visible safety measures, under civilian labels. Such a node carries a dual threat, military because it feeds the front and environmental because any damage to it sends product straight into the water, and responsibility for the environmental consequences rests with the side that built it this way and in this place.

Contamination on the water: spill dynamics

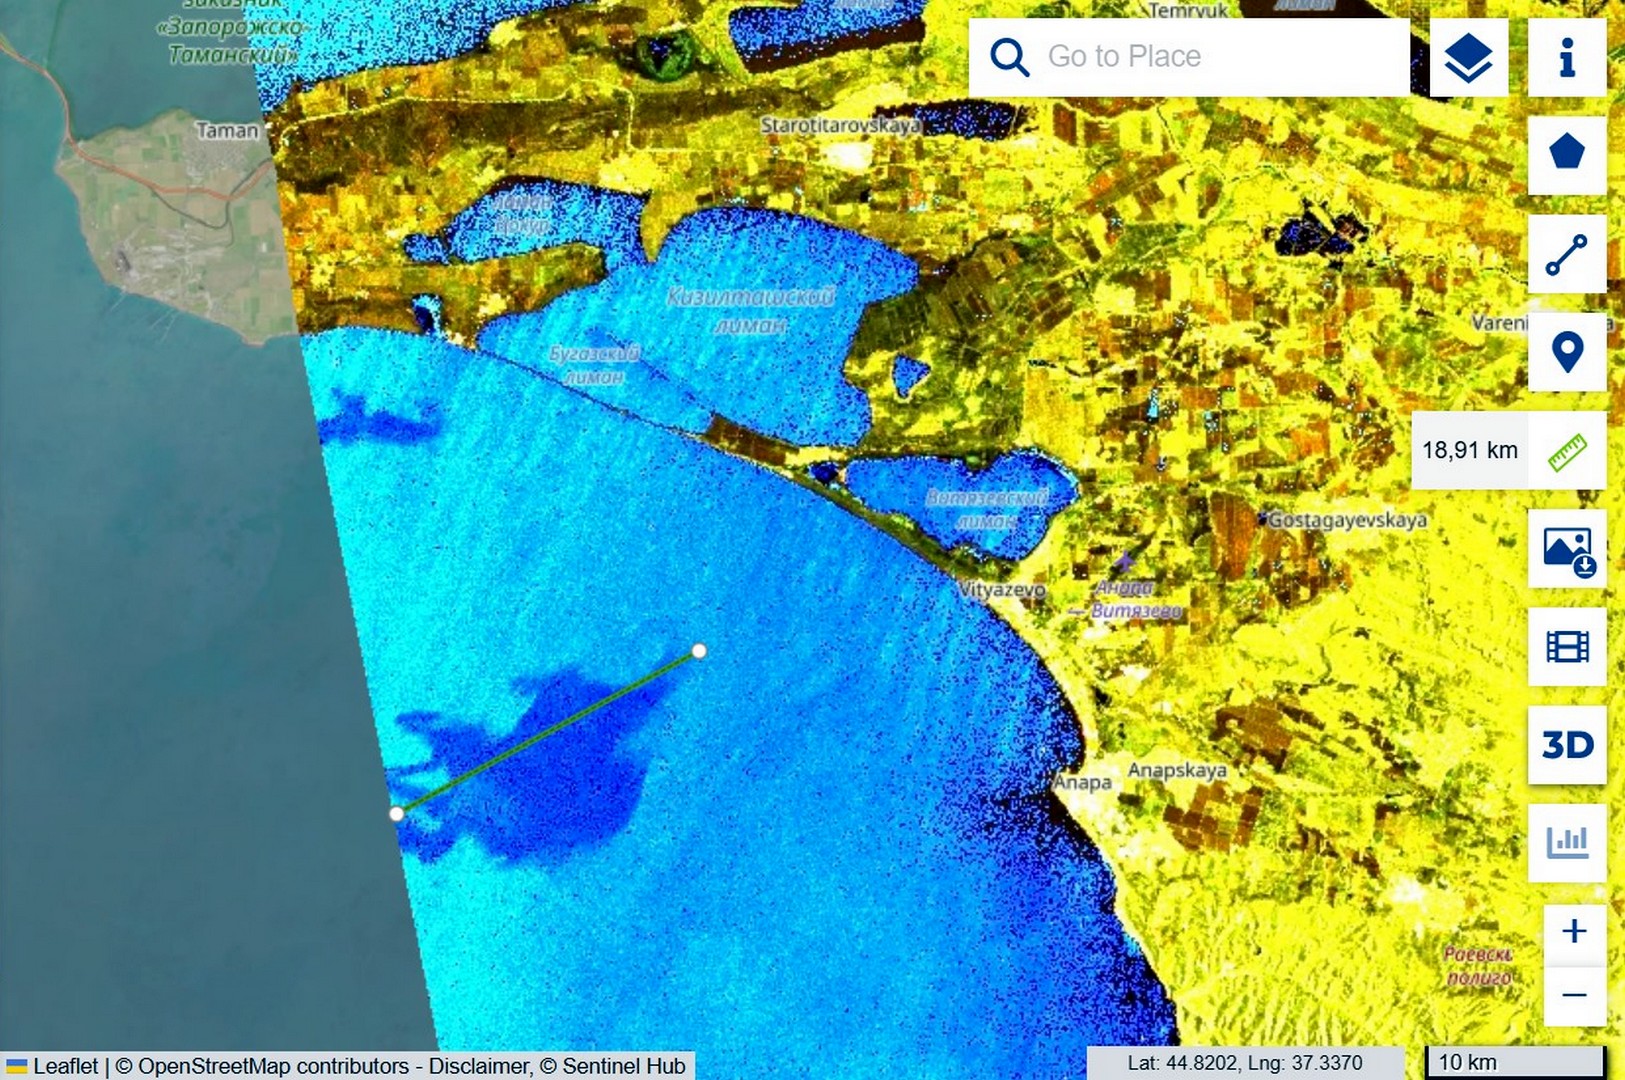
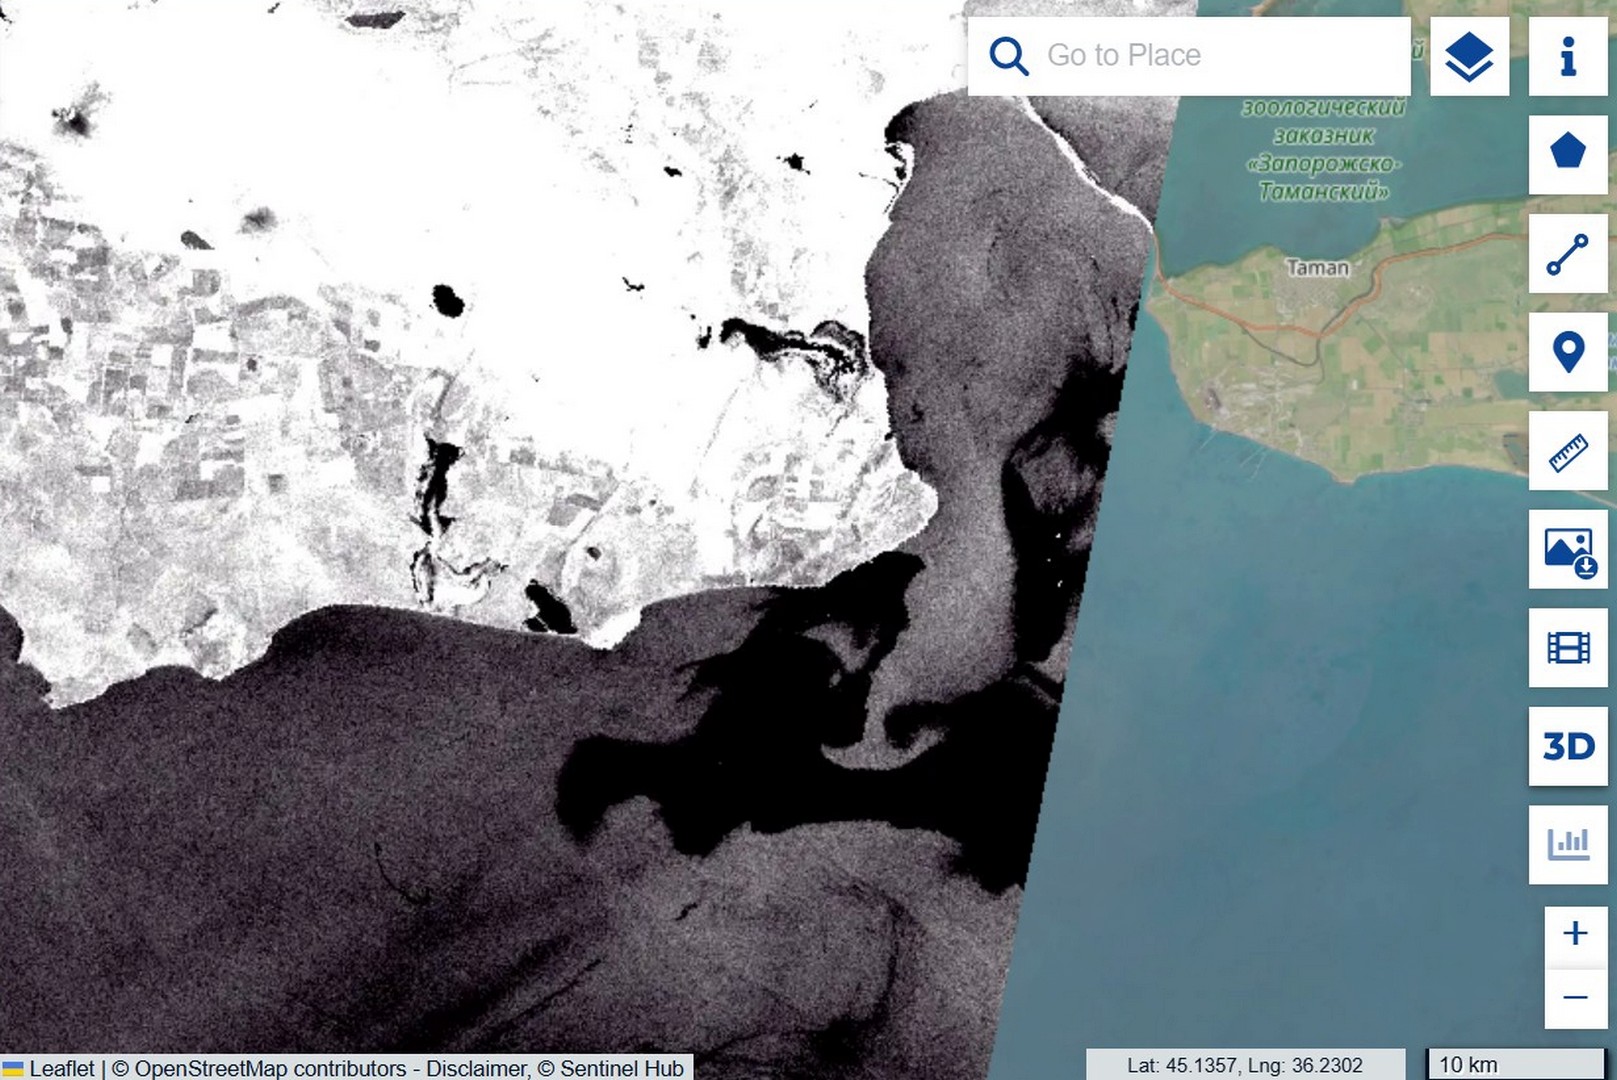
While Russian media spoke of grain and oil, the satellites were recording the actual slick, and doing so in two different ways. On the very first day the Sentinel-2 optical image of 31 July, captured under sun glint that reveals the film’s surface smoothing, allowed the early contamination to be outlined by polygon, yielding a bounding area of about 111 square kilometres. That figure must be read correctly: it is the area of the envelope, not a continuous film, because within it the product is scattered as separate fingers and streaks, and only a fraction of the water is actually covered. The slick was then tracked by Sentinel-1 radar, which detects the dampening of small waves even through cloud: on 1 August a compact plume 18.91 km long south of Taman, and on 4 August a tongue stretched to 40.44 km with vortex structures at the current boundary. The transport rate is roughly 7–8 kilometres per day, and the source was not a one-off, since fresh FIRMS hotspots on 4 August show that inflows continued.

Sentinel-2 sun glint: 111.19 km² pollution bounding area and about 100.93 km smoke plume
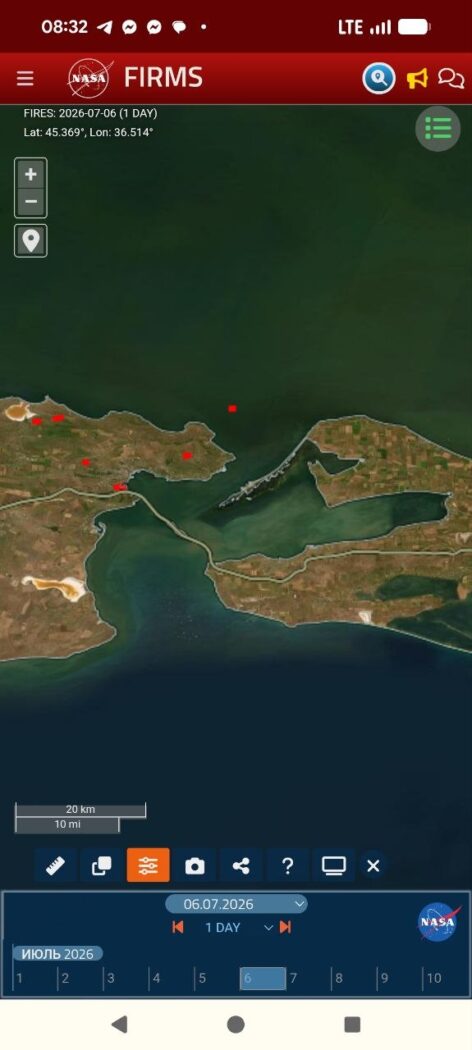
Photo 5. Sentinel-2, 31 July 2026, sun glint. A polygon gives the bounding area of the early contamination, 111.19 km²; a ruler gives the plume length, about 100.93 km. Source: Sentinel Hub.
Sentinel-1, 1 August: compact 18.91 km pollution plume south of Taman
Sentinel-1, 4 August: pollution tongue stretched to 40.44 km with vortex structures
Photos 14, 15. Sentinel-1 IW, 1 and 4 August 2026. Drift of the film from 18.91 km to 40.44 km over three days to the south-west. Source: Sentinel Hub.

Movement forecast: from Anapa to the Kerch peninsula

From 30 July to 2 August a north-easterly wind of 5–14 metres per second drove the film south-west, towards the coast of Anapa, and on 4 August it swung southerly and eased to 2–4 metres, so the outflow to open sea stopped and the contamination began to be drawn back towards the mouth of the strait. For the shorelines this means that at Anapa the risk persists on the shallows while new inflows cease, whereas the main threat shifts to the western shore of the Kerch peninsula, towards Kerch and on to Feodosia, where a weak southerly wind will draw the film. The exact heading beyond two or three days is hard to predict, because under a weak synoptic background the sea-breeze cycle takes over, onshore by day and offshore by night.

Update 5–8 August: the forecast held, and oil surfaced on the water

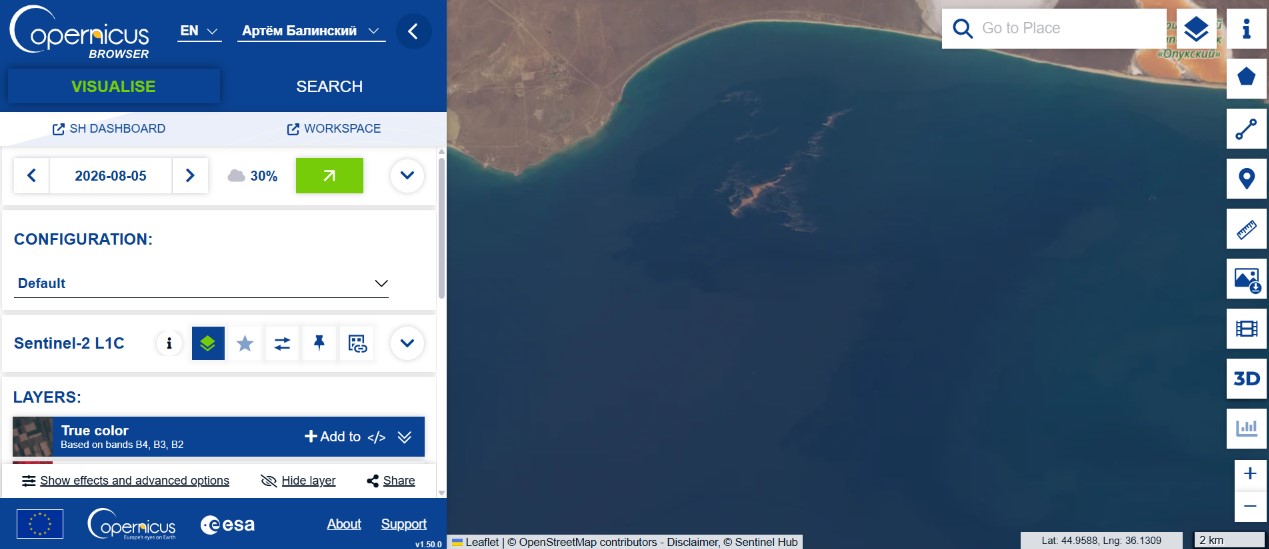
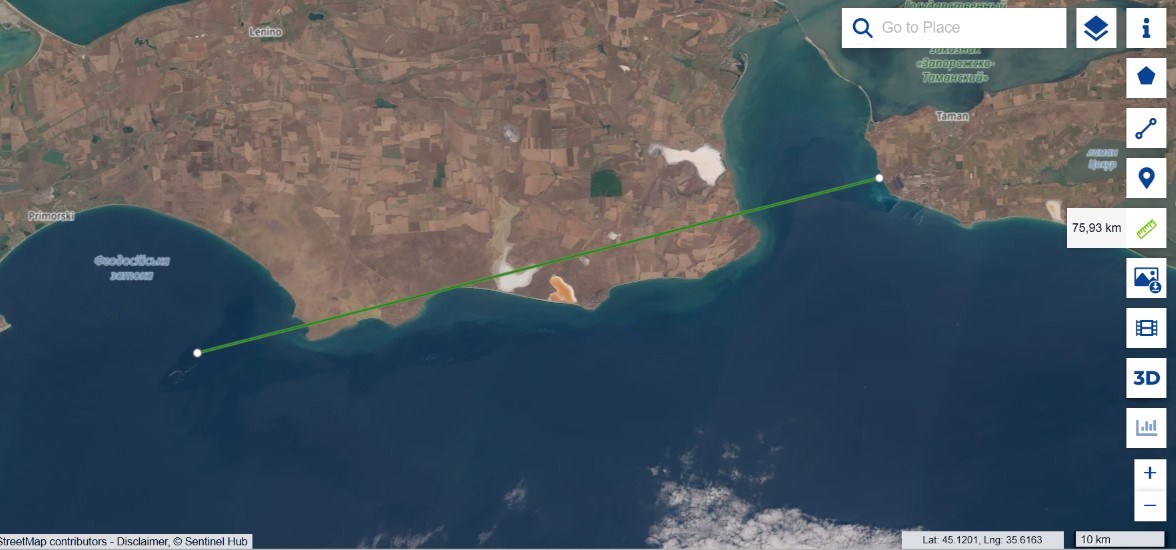
A few days after first publication new Sentinel-2 frames became available, confirming two of our conclusions and substantially strengthening a third. The drift forecast held: we wrote that once the wind reversed the contamination would be drawn along the western shore of the peninsula towards Feodosia, and that is what happened. On the 5 August image the slick is recorded along the southern shore, near the Opuk reserve and the Feodosia gulf, and on the 8 August frame the total transport length from Taman reaches 75.93 kilometres, against 40 four days earlier. The slick did not dissipate; it stretched along the coast exactly along the predicted scenario.

Sentinel-2, 5 August: contamination along the southern Kerch Peninsula near Opuk and Feodosia
Sentinel-2, 8 August: pollution transport extending 75.93 km from Taman
Photo 16. Sentinel-2, 5 August 2026. Contamination along the southern shore of the Kerch peninsula (Opuk, Feodosia). Photo 17. Sentinel-2, 8 August 2026. Transport length from Taman, 75.93 km. Source: Sentinel Hub.

The decisive point, however, is the nature of the light-coloured contamination. Along the shore a dense, form-holding yellowish structure is visible, not a thin iridescent sheen but thick emulsified ridges, and that is a diagnostic feature. Light petroleum products have low viscosity, spread into a thin film within minutes and give a silvery-iridescent sheen, but do not form dense ridges, having nothing to hold structure with. Fuel oil and crude, by contrast, are dark, because a thick layer absorbs light. Vegetable oil is viscous and emulsifies under wave action, forming a dense light phase resembling yellow sour cream, so a dense yellow ridge matches neither light petroleum products nor fuel oil and points to a viscous, emulsifiable substance, most probably vegetable oil.

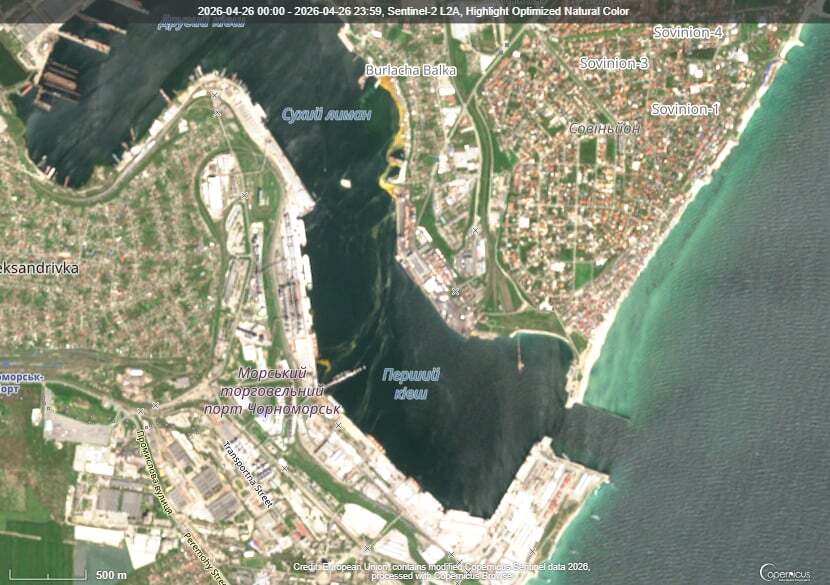
We have seen this same signature before. After the strike on Chornomorsk on 26 April 2026, where a confirmed sunflower-oil spill occurred, the water developed the same dense yellow emulsified structures, and the morphology matches.

Sentinel-2, 26 April 2026: dense yellow emulsified structures from the confirmed vegetable-oil spill near Sukhyi Lyman in Chornomorsk
Reference: Sentinel-2, 26 April 2026, Chornomorsk. Dense yellow emulsified structures of a confirmed oil spill near the shore (Sukhyi Lyman). Source: Sentinel Hub.

This is a morphological comparison of optical frames, not a spectral proof of substance identity, so “the same emulsified morphology, characteristic of vegetable oil” is a conclusion grounded in remote-sensing evidence rather than a substitute for laboratory confirmation.

What this means for the whole story is that the two accounts, the Russian one of oil and grain and the Ukrainian one of petroleum, stop being mutually exclusive, because the data show both, but separately, each by its own signature. Fuel burned, as the FIRMS heat and the black smoke attest, and alongside it, at a mixed terminal, there was oil that leaked on impact, did not burn as in the eight documented cases, and days later surfaced as light ridges along the coast. Not “either/or,” but “fuel burned and oil spilled,” with each component proven by its own independent signature.

What comes next. On the imagery the yellow emulsified ridge is effectively already within the Feodosia gulf, and the Feodosia shore is not far from there. The wind is carrying it precisely that way, so in the coming days the oil should appear along the Feodosia coast and adjacent stretches of the southern Crimean shore. This is no longer a distant forecast but a matter of a few kilometres and a few days.

Consequences for the marine environment

The facility sits on the shore, right at the waterline, without secondary containment or visible engineering barriers, so any damage to the tanks sends product straight into the sea. This occurs in a sensitive body of water: the Black Sea is anoxic below 150–200 metres, living benthos exists only on a narrow strip of shelf, and additional loading presses it against the hydrogen-sulphide boundary. The area’s benthic filter feeders, mussels, polychaetes and small crustaceans, are also the forage base for commercial fish, so damage to the bottom propagates through the whole food chain.

Petroleum products and vegetable oil act differently, and this matters for assessing the consequences. Petroleum products carry carcinogenic toxicity through polycyclic aromatic hydrocarbons; part evaporates, the rest settles. Vegetable oil has no carcinogenic properties but behaves more insidiously: in summer, under ultraviolet light and in warm water, it polymerises, hardening into a dense benthic cap almost impermeable to oxygen. According to NOAA, such polymerised oil persists on the bottom for more than six years; without polymerisation it would biodegrade within half a year, but the Taman strike occurred at the height of summer, in conditions that guarantee polymerisation. Storm-driven resuspension returns the sediment to the water column season after season. For birds the oil is more dangerous than fuel oil, because it disrupts feather microstructure so that washing cannot restore it, and by our field observations after the December 2025 spill no more than five percent of the birds counted as rescued actually returned to the wild. A detailed treatment of these mechanisms, with references to the scientific literature and field data, is given in our report on the third oil spill in Odesa Bay.

The consequences are not local. Currents carry the contamination along the coast into the open Black Sea, where the cyclonic circulation spreads it over hundreds of kilometres, or northward through the strait into the shallow, spawning-ground Sea of Azov. Fuel oil from the Volgoneft wrecks in this same waters was recorded in the Tuzly Lagoons near Odesa, over 650 kilometres away, and every new accident is layered on the previous ones while the sea cannot process the load. Our field confirmations are compiled in the Tuzly Lagoons research and on the Environmental Evidence Platform.

In lieu of conclusions: what is established, what remains open

Established by direct observation and instruments: a continuous multi-day fire at the site from 30 July to 4 August (FIRMS); early film contamination of about 111 km² and a smoke plume of about 100 km (Sentinel-2); drift of the film from 19 to 40 km (Sentinel-1) and on to 76 km as of 8 August; that fuel burned rather than agricultural produce, along three independent lines; that the light contamination shows an emulsified morphology characteristic of vegetable oil, matching the reference spill at Chornomorsk; and that the drift forecast along the Kerch peninsula held.

What remains hypothesis is the specific fuel type and the reason for its presence at a civilian-labelled site, the exact area of continuous film since the satellite gives only the envelope, the trajectory beyond two or three days since current data are required, and the full extent of harm to biocenoses without field verification, because there is no access to the occupied shore.

Sources and data

  1. Sentinel-1, Sentinel-2 — ESA / Copernicus (Sentinel Hub).
  2. NASA FIRMS — thermal anomalies, 28 July — 8 August 2026.
  3. Surface weather observations, Opasne station; ECMWF forecast.
  4. Persistence of vegetable oil on the seabed — NOAA, Non-Petroleum Oil Spills.
  5. Methodology: DOI 10.20535/EHS2710-3315.2025.332100.
  6. Statements by the parties are given per official communications and require verification against primary sources.

Author: Vladyslav Balinskyi, editor-in-chief, «Zeleniy Lyst». Satellite data: ESA/Copernicus. Thermal data: NASA FIRMS. This is an analytical material; factual claims are kept separate from hypotheses.

ByVladislav Balinsky

Sinking of Golden Leo: Environmental Risks in the Black Sea

Environmental monitoring · Odesa Bay · July 2026

The loss of Golden Leo is not an isolated maritime casualty. It adds another layer of pressure to waters already affected by the destruction of the Kakhovka Dam, heavy-fuel-oil pollution and wartime attacks. Fuel, bilge water, a cargo of corn and an unstable hull may act at the same time—at the surface, near the seabed and within marine sediments.


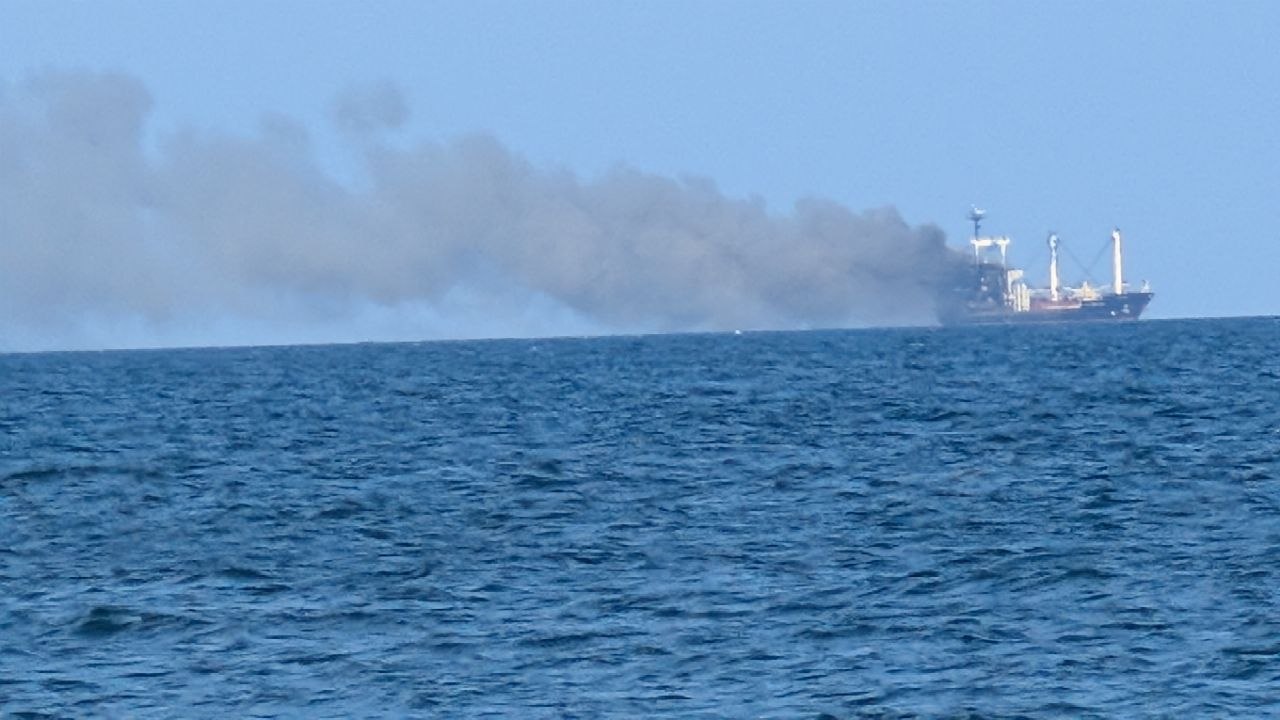
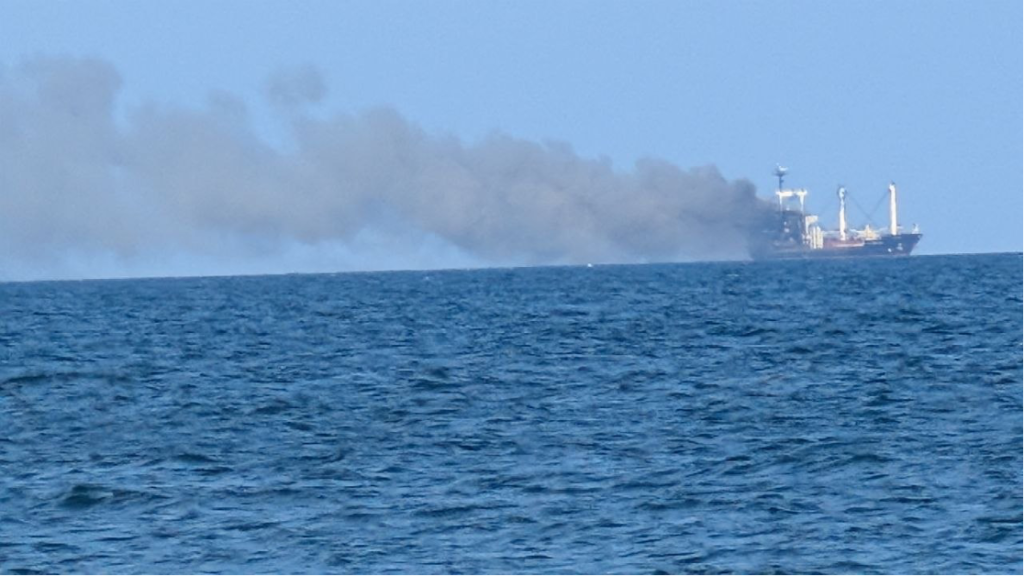
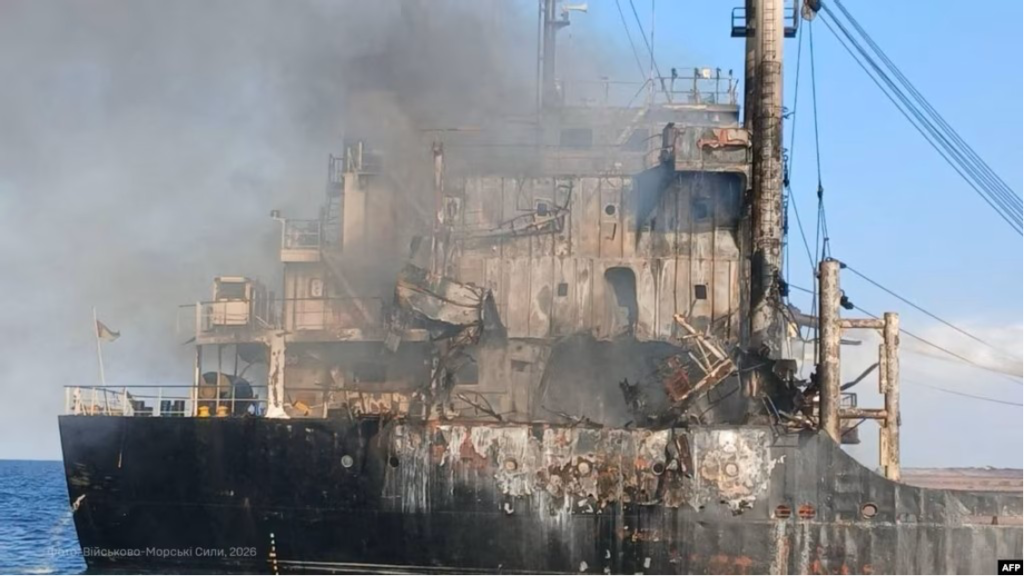
Golden Leo trailing smoke after a Russian missile strike in the Black Sea on 19 July 2026
Golden Leo after a Russian missile strike in the Black Sea on 19 July 2026. Photo: Vladyslav Balinskyy.

War is changing the Black Sea not only through explosions, but through processes whose effects may persist for years. The destruction of the Kakhovka Dam, heavy-fuel-oil pollution following the casualty involving Russian tankers in the Kerch Strait, sunken vessels and attacks on civilian shipping are creating an interconnected system of risk.

Golden Leo adds another potential source of pressure roughly five nautical miles off Odesa, in shallow coastal waters strongly influenced by wind-driven circulation.

For Odesa Bay, the sinking of Golden Leo is not only a human tragedy but a new source of long-term environmental risk. A large wreck containing fuel, technical fluids and a cargo of corn may affect surface waters, bottom waters, seabed sediments and the safety of navigation.

What happened

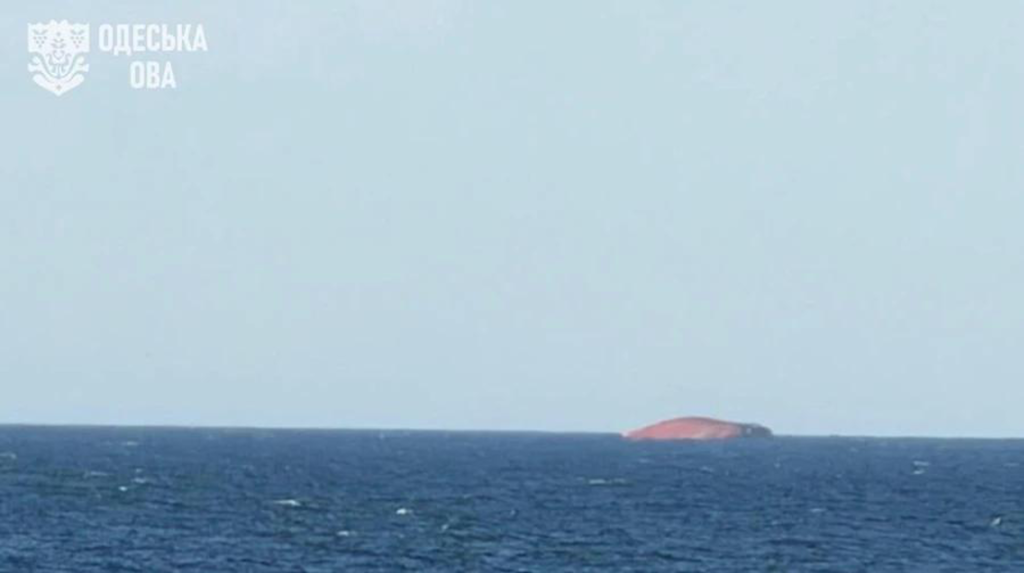
On 19 July, the Guinea-Bissau-flagged merchant vessel Golden Leo, carrying Ukrainian corn, came under a Russian missile attack while leaving the port of Chornomorsk through Ukraine’s maritime corridor. Ten people were killed—nine crew members and a Ukrainian maritime pilot. After several days of damage-control efforts, the vessel was no longer seaworthy and sank on 26 July, approximately five nautical miles off the Odesa coast.


Golden Leo almost completely submerged off the Odesa coast on 26 July 2026
Golden Leo sinking off the Odesa coast on 26 July 2026. Photo: Odesa Regional Military Administration.

Among the many Odesa residents who witnessed the disaster was Vladyslav Balinskyy, a researcher at Tuzly Lagoons National Nature Park and head of the Odesa branch of the National Ecological Centre of Ukraine.

“The ship was struck in three successive missile attacks. After the first hit, the Russians waited roughly seven or eight minutes—the very period when pilot boats, emergency responders and other support craft would normally approach a damaged vessel. A second strike followed, and then a third,” Balinskyy says.

Three successive strikes on a civilian vessel turned an immediate human tragedy into a long-term engineering and environmental problem.

Golden Leo and a smoke plume over the sea after successive Russian missile strikes on 19 July 2026
Golden Leo after the attack. Photo: Vladyslav Balinskyy.

The damaged and smoking superstructure of Golden Leo after the Russian missile strike on 19 July 2026
Damage to Golden Leo after the Russian strike on 19 July 2026. Photo: Ukrainian Navy.

Attacks on civilian shipping have become systematic

Since spring 2026, Russia has sharply intensified attacks on civilian shipping in the Black Sea. According to Ukraine’s Deputy Prime Minister for Restoration, Oleksii Kuleba, more than 70 attacks on merchant vessels had been recorded since the beginning of the year.

According to the Odesa Regional Prosecutor’s Office, 28 civilian vessels were hit in the ports of Greater Odesa in just one month, from the second half of June to the second half of July. Twenty-six were foreign-flagged and two were Ukrainian. The attacks killed 21 people and injured another 34.

Among the first documented incidents of 2026 was a strike on 18 May against a Marshall Islands-flagged merchant vessel owned by a Chinese shipowner. On 29 May, the Vanuatu-flagged bulk carrier ANT was hit while leaving a port in Odesa region for Türkiye. A fire broke out on board and two crew members were injured.

On 22 June, Russia carried out another attack on civilian vessels in the Black Sea. At least three merchant ships flying the flags of Panama, Vanuatu and China were struck. A cook from Egypt was killed on one vessel, while eight other seafarers had to abandon ship in a life raft.

The pace of attacks rose sharply in July. Within a single week, vessels flying the flags of Saint Kitts and Nevis, Togo, Tanzania, Liberia, the Marshall Islands, Antigua and Barbuda, Palau and other states were reported hit. Some vessels were attacked more than once.

The 19 July strike on Golden Leo became the culmination of that escalation.

Several days earlier, on 13 July, the International Maritime Organization formally condemned a series of attacks on civilian merchant vessels in the Black Sea and the Sea of Azov and called for attacks on international shipping to stop.

On 23 July, Ukraine’s Ministry of Agrarian Policy reported that the sharp rise in Russian attacks had prompted shipowners to temporarily suspend calls at Ukrainian Black Sea ports.

On 27 July, the UN Security Council held an emergency meeting on the safety of civilian shipping in the Black Sea. According to the UN, more than 40 crew members were killed or injured in attacks on civilian vessels during July alone.

The rising threat has already disrupted maritime logistics. Lloyd’s List Intelligence described operating conditions as the worst since the Black Sea Grain Initiative ended in 2023. Insurance premiums and freight rates increased, while some international operators, including Maersk, temporarily suspended selected Ukrainian services because of the security situation.

Two very different approaches to warfare at sea

Balinskyy argues that the Golden Leo case exposes a fundamental distinction between military operations designed to disrupt an opponent’s logistics and attacks directed at civilian shipping.

Ukraine’s Unmanned Systems Forces conducted Operation Molochka from 6 to 28 July with the aim of cutting fuel-supply routes serving Russia’s southern military grouping.

Russia used occupied Crimea as a transport and logistics hub. Across the Sea of Azov, small tankers and cargo vessels of the Volgoneft, Volgobalt and related designs regularly moved substantial quantities of fuel and lubricants. The existence of that transport system in itself posed a potential threat to the ecosystems of the wider Black Sea–Azov basin.

A detailed satellite-based assessment is available in the Green Leaf investigation “201 Vessels Hit—but Not 201 Fires: Satellite Analysis of Operation Molochka”.

Reflecting on the environmental consequences of Operation Molochka, Balinskyy says:

“Ukraine’s objective was to shut down this logistics network, but to do so as precisely as possible. During the period we analysed, from 6 to 27 July, we found no evidence of widespread ship fires or large-scale releases of petroleum products into the sea. Although 129 vessels operated in the segment we examined, and more than two hundred were active across the wider Black Sea–Azov basin, we observed only two comparatively long-lasting fires and several local fuel leaks. At the same time, the logistics system itself effectively ceased to function.”

In his view, the attack on Golden Leo followed a fundamentally different logic.

Balinskyy’s assessment is that the objective was not simply to disable the vessel, but to maximise loss of life, destroy a civilian ship and create long-term risks for maritime transport and the marine environment.

“The warhead of a cruise missile is incomparably more powerful than that of an attack drone and may contain around 300 kilograms of explosive. The attack killed ten people, critically damaged the vessel and ultimately caused it to sink. Beyond the human tragedy, it created potential environmental risks that now require long-term monitoring and scientific assessment,” Balinskyy says.

After the vessel went down, the Odesa Regional Military Administration convened an emergency meeting of its commission on technological and environmental safety.

The commission introduced continuous monitoring of the Black Sea area to assess potential effects on the environment and on navigation safety.

Authorities are paying particular attention to possible leaks of fuel and lubricants into the sea.

But is surface surveillance alone enough to evaluate all the environmental consequences of a large merchant ship lying on the seabed?

Potential sources of pollution

In this context, the sinking of Golden Leo presents serious environmental risks for the north-western Black Sea and Odesa Bay. The effects are likely to remain local, but local does not mean insignificant. Odesa Bay is shallow and partly enclosed, and its water circulation depends heavily on wind direction and strength. Under certain weather and sea conditions, pollutants from the wreck site could be carried towards the coast.

The main potential sources of contamination are fuel, lubricants, hydraulic fluids, other technical substances and bilge water. Large bulk carriers have complex networks of fuel tanks, pipelines and machinery spaces that may retain considerable quantities of petroleum products after a casualty. Preliminary estimates suggest that a vessel of this class might have carried anything from several dozen tonnes to roughly 100–150 tonnes of heavy marine fuel. The actual amount can be established only from the ship’s documentation.

Bilge water poses a separate hazard. It is a mixture of water, fuel, lubricants and other technical fluids that accumulates in machinery spaces. If released, it can become another source of toxic contamination.

Surface waters

Fuel, lubricants and technical fluids may form films or slicks whose movement will depend largely on wind, waves and surface currents.

Bottom waters

Decomposition of the organic cargo may consume dissolved oxygen, alter local water chemistry and create oxygen-depleted conditions near the seabed.

Seabed sediments

Petroleum products and decomposition residues may accumulate in sediments and later be released during storms or if the wreck shifts.

The wreck itself

Instability, corrosion and storm loading may open new leakage pathways even when no visible contamination is present at the surface.

“Each individual object may have only a local effect, but the combined impact of many such sources is complex, cumulative and largely unpredictable,” Vladyslav Balinskyy says.

How a cargo of corn can affect the marine ecosystem

The ship’s cargo also requires attention. Corn is a natural material, but a large mass of organic matter concentrated in one place can still alter the marine environment. Some grain has reportedly been found on the shore of Odesa Bay, while most of the cargo is thought to remain inside the holds.

When large quantities of grain remain submerged, they can swell, ferment and gradually decompose. These processes consume dissolved oxygen, potentially creating local oxygen-depleted zones and changing conditions near the seabed. Anaerobic decomposition may also generate gases and organic compounds that affect benthic ecosystems.

At least two different impact pathways may therefore operate at the same time: surface contamination from possible fuel and lubricant leaks, and near-bottom changes caused by the decomposition of organic cargo. Their development will depend on weather, currents and local circulation.

Why an underwater survey is essential

Balinskyy says the immediate priority should be a detailed underwater survey of the wreck. Investigators need to determine how the hull is resting on the seabed, whether it is stable, whether autumn and winter storms could shift or break it apart, and what condition the fuel tanks, pipelines, access hatches and damaged sections are in.

Only then will it be possible to decide whether the hull needs to be sealed, whether fuel and bilge water should be pumped out, whether the wreck requires additional stabilisation, or whether other engineering measures are necessary. The site also needs clear navigational marking and long-term structural monitoring.

The feasibility of removing the corn requires a separate technical assessment. That decision depends on the vessel’s position, the condition of the holds, the extent of structural damage and whether the cargo can be reached safely.

Immediate questions that need answers

  • How the hull is positioned and whether it is stable at a depth of about 20 metres;
  • The condition of fuel tanks, pipelines, access hatches and breaches;
  • Whether the wreck can be sealed and fuel or bilge water pumped out;
  • The condition of the holds, the distribution of the corn and whether the cargo can be reached safely;
  • Whether the hull needs stabilisation, navigational marking and long-term structural monitoring.

War is creating a new human-driven regime in the Black Sea and the Sea of Azov

Golden Leo is only one example of the environmental consequences of Russia’s full-scale war at sea.

Since the full-scale invasion began, the Black Sea and the Sea of Azov have become active theatres of war. Missile strikes on port infrastructure, attacks on civilian shipping, mined sea routes, sunken vessels, fuel leaks, destroyed hydraulic structures and the constant presence of military hardware are creating new forms of pressure on marine ecosystems.

Among the largest environmental shocks of recent years are the destruction of the Kakhovka Dam, which sent enormous volumes of organic matter, pollutants and sediments from the Dnipro basin into the Black Sea; the casualty involving Russian tankers in the Kerch Strait, which caused extensive heavy-fuel-oil pollution; and repeated attacks on civilian vessels using Ukraine’s maritime corridor.

Balinskyy argues that these events cannot be assessed in isolation.

“Existing damage is now being compounded by newly sunken vessels and by fragments of missiles and drones entering the marine environment. All of these objects may release petroleum products, metals, polymers and other pollutants. We are not dealing with separate incidents, but with accumulating pressures that must be studied as one system.”

In his assessment, the full-scale war has created an entirely new human-driven operating regime in the Black Sea. Before 2022, the main pressures were river runoff, shipping, agriculture, industrial pollution, eutrophication and climate change. They have now been joined by sunken vessels, missile and drone debris, munitions, damaged hydraulic infrastructure, fuel leaks and the large-scale movement of contaminated sediments.

Each pressure may appear local when considered alone. But currents, waves, storms and sediment transport connect them into a single system in which the effects of different events accumulate, interact and may emerge months or even years later.

“That is why responding to individual pollution incidents is no longer enough. We need to understand how the Black Sea ecosystem is changing as a whole and how different sources of pressure interact,” Balinskyy says.

The same cumulative pattern is visible in field research along the coast of Tuzly Lagoons National Nature Park, where scientists are documenting heavy fuel oil, fragments of Russian aerial systems and the deaths of marine mammals at the same time.

From isolated incidents to systematic monitoring

Golden Leo again shows that dealing with the immediate aftermath of an accident is not enough. Environmental damage must also be documented systematically—for scientific assessment, future damage calculations, international investigations and the restoration of marine ecosystems.

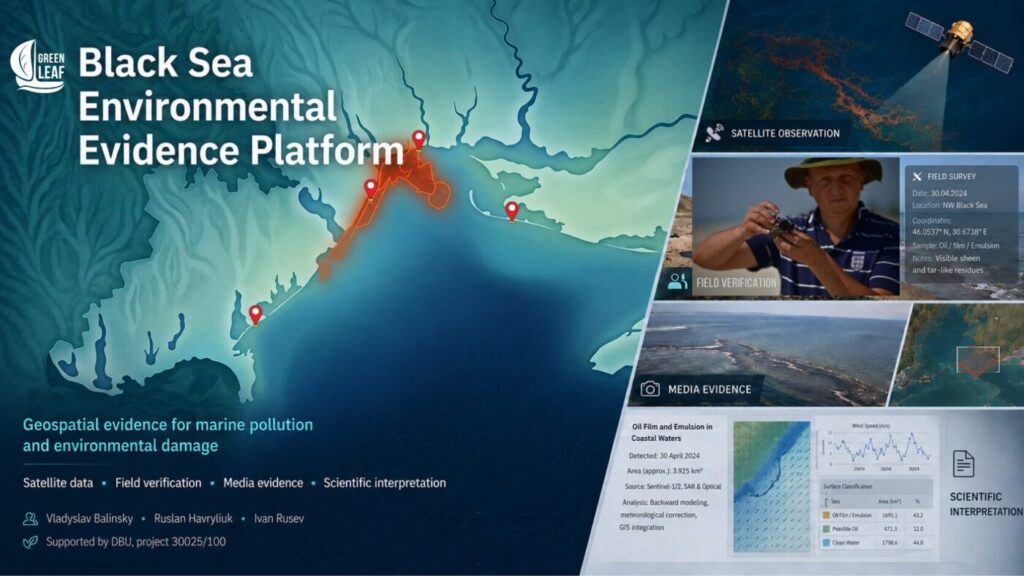
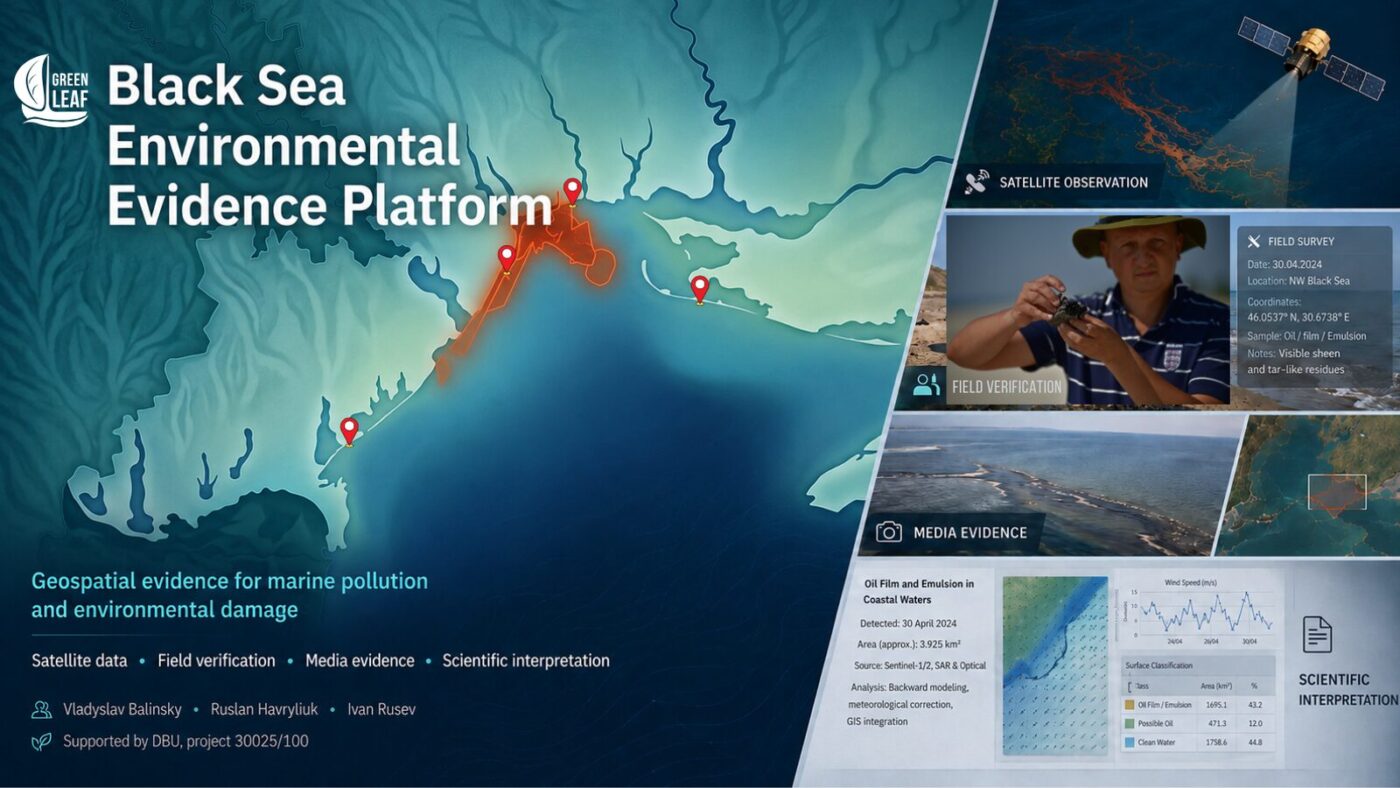
To support that work, the non-governmental organisation Green Leaf, together with scientists from Tuzly Lagoons National Nature Park, developed the Black Sea Environmental Evidence Platform. It brings together Sentinel satellite data, field observations, laboratory analysis and photographic records. Each entry preserves coordinates, observation dates, sources, verification methods and scientific caveats.


The Black Sea Environmental Evidence Platform combining mapped incidents, satellite data and field verification
The Black Sea Environmental Evidence Platform brings together satellite data, field verification, media evidence and scientific interpretation.

The Platform does not determine legal responsibility. Its purpose is to preserve verifiable evidence that may support environmental assessments, damage evaluation and international legal proceedings.

The system has already been tested while documenting the Volgoneft tanker casualty and vegetable-oil spills in the ports of Pivdennyi and Chornomorsk. It can also be used to record the consequences of the sinking of Golden Leo, attacks on civilian vessels, marine pollution and other wartime incidents.

Balinskyy believes that Black Sea monitoring should become a continuous observation system combining satellite surveillance, field research, analysis of water and sediments, and structural monitoring of wrecks and other technological hazards.

Unlike water samples, which capture conditions only at the moment they are collected, sediments accumulate petroleum products, heavy metals, microplastics, organic pollutants and other substances over long periods. Storms, dredging and other natural or human-driven processes can release those contaminants back into the water, turning the seabed into a secondary source of pollution.

Monitoring around Golden Leo should therefore extend far beyond looking for visible oil slicks. It should include bottom-water and sediment sampling, measurements of petroleum hydrocarbons, organic matter and dissolved oxygen, and repeated observations around the wreck over an extended period.

Only this kind of integrated approach can assess more than the consequences of a single casualty. It can also help explain how war is gradually changing marine ecosystem function and creating new long-term risks across the Black Sea and the Sea of Azov.

Monitoring Golden Leo must not end with a search for an oil slick. It should track the hull, surface and bottom waters, dissolved oxygen, organic matter, petroleum products and seabed sediments across seasons and storm cycles.

Sources and related reading

  1. National Ecological Centre of Ukraine — the original Ukrainian publication by Tetyana Herasymova on which this adapted edition is based.
  2. National Ecological Centre of Ukraine — background on the long-term effects of the destruction of the Kakhovka Dam on the Black Sea.
  3. National Ecological Centre of Ukraine — background on heavy-fuel-oil pollution following the casualty involving Russian tankers in the Kerch Strait.
  4. USM — reporting on the attack against Golden Leo and the circumstances of the incident.
  5. Reuters — reporting on the vessel’s loss on 26 July 2026.
  6. Ministry for Communities and Territories Development of Ukraine — the reported number of attacks on merchant vessels since the beginning of 2026.
  7. Radio Free Europe/Radio Liberty, Ukrainian Service — figures from the Odesa Regional Prosecutor’s Office on vessels hit, fatalities and injuries.
  8. International Maritime Organization — statement on attacks against civilian shipping in the Black Sea and the Sea of Azov.
  9. Latifundist — reporting on the temporary suspension of vessel calls at Ukrainian ports.
  10. USM — reporting on the emergency UN Security Council meeting on attacks against shipping.

Related articles from Green Leaf

Editorial note. This is an English editorial adaptation of the Ukrainian article published by the National Ecological Centre of Ukraine. The title, introductory framing, structure, visual presentation and links to the Green Leaf series were adapted for an English-language audience; the author’s reporting and the expert assessments were preserved.

ByVladislav Balinsky

201 Vessels Hit — but Not 201 Fires: Satellite Analysis of Operation Molochka

Satellite investigation · Sea of Azov and Black Sea · July 2026

Crimea and the Kerch Strait have become a hub where russia’s military logistics overlap with one of the most vulnerable parts of the Azov–Black Sea basin. The satellite analysis of Operation Molochka examines whether strikes on this system led to mass vessel fires and a new oil catastrophe.

Crimea and the Kerch Strait may be the worst possible location for concentrating fuel logistics anywhere in the Azov–Black Sea region. The narrow, shallow strait connects two marine basins, while the direction of water exchange changes regularly. Pollution entering this area can spread into both the Sea of Azov and the Black Sea, join coastal circulation and reappear hundreds of kilometres from its source.

It is precisely in this environmentally sensitive area that russia concentrated ports, ferry crossings, fuel facilities and a mixed fleet supplying its southern military grouping through occupied Crimea. The July satellite series makes it possible to assess the environmental cost of striking this system.

Satellite analysis of Operation Molochka considers not individual tankers, cargo ships or barges, but the maritime link of a large transport-and-fuel system. Through ports and roadsteads in the Sea of Azov, the Kerch Strait, ferry crossings, warehouses and routes through occupied Crimea, russia sustains military flows on the southern axis.

In the spatial and dynamic analysis of the Kerch logistics hub the Green Leaf team previously showed that transport, fuel and support infrastructure operate here as a single system. Its military function is defined not by a port’s signboard or a vessel’s formal status, but by the flows passing through them. The same principle was formulated in the investigation of the Elektrostal fire: dual use is a property of logistics, not of a single building or vehicle.

For the Kerch hub, this logic carries an especially high environmental cost. Military-significant transport, fuel infrastructure and an ageing fleet are concentrated directly at the hydrodynamic transition between the Sea of Azov and the Black Sea. An accident or rupture of cargo tanks at such a location does not remain local: the substance enters existing natural flows and can be carried far beyond the initial site. The Volgoneft tanker disaster demonstrated this in practice, when heavy fuel oil from the strait was later recorded on the Ukrainian coast.

Environmental vulnerability clearly did not constrain russia when it built this logistics model. On the contrary, civilian ports, merchant vessels, fuel facilities and military flows were brought as close together as possible to make supply routes more resilient. The resulting risk was transferred to both marine basins, their coastal ecosystems and the people living along their shores.

The figure of 201 vessels hit therefore requires an environmental as well as a military reading. The central question is whether an operation of this scale meant dozens of burning tankers, breached cargo tanks and large fields of petroleum products, or whether the strikes mainly removed vessels from the logistics chain without destroying their cargo on a mass scale.

To answer it, the Green Leaf research group and the National Ecological Centre of Ukraine analysed the entire key area: the western Sea of Azov near the Kerch Strait, Temryuk Bay, the Kamennyi Cape area and the roadstead off Primorsko-Akhtarsk. Regional maps show numerous fires on land and around ports, but this investigation focuses on a narrower and more fundamental question: the degree of damage to vessels and the environmental footprint of the maritime part of the operation.

The time series made it possible to isolate two vessel-related episodes and several zones of surface oil pollution. Their relationship to the reported scale of the operation allows the military effect and the environmental cost to be assessed separately.

The assessment used NASA FIRMS thermal detections, Sentinel-2 optical scenes and Sentinel-1 radar imagery from 6 to 27 July. Surface oil pollution was identified using an integrated methodology combining radar detection, optical verification, meteorological correction and analysis of slick movement.

The methodology is described in a scientific paper by Vladyslav Balinskyi, Ruslan Havryliuk, Vitalii Hulevets and Mihaela Timofti: DOI 10.20535/EHS2710-3315.2025.332100. Ambiguous signatures were excluded from the evidence series. Some real slicks may therefore have gone undetected, but the objects presented below are classified as confirmed surface oil pollution.

Limits of the satellite method. Without sampling, it is impossible to determine the specific petroleum product, the thickness of the film or the exact mass released. A satellite image likewise cannot establish the legal responsibility of a particular vessel without AIS records, port data or other independent sources.

Satellite analysis of Operation Molochka: the regional picture

Three NASA FIRMS frames show the same western sector of the Sea of Azov. The one-day scene for 6 July already records a thermal signature at sea. The cumulative view for 6–27 July overlays every thermal event in the interval: many appear on land and near ports, while only one source remains at sea in this sector. The 21 July frame captures the final phase of its thermal activity.

201 reported strikes — and a very different picture at sea: one prolonged thermal source, a second brief smoke episode and several local oil slicks. This ratio is the key to the entire satellite series.

6 July · one day

NASA FIRMS thermal signature in the western Sea of Azov near the Kerch Strait on 6 July 2026, one-day view

6–27 July · three weeks

Three-week NASA FIRMS cumulative view from 6 to 27 July 2026 showing one marine source in the western Sea of Azov

21 July · one day

Final NASA FIRMS thermal detection at the same marine location near the Kerch Strait on 21 July 2026
The same area in the western Sea of Azov. Left: the one-day detection on 6 July. Centre: a cumulative view of all thermal events from 6 to 27 July, showing one marine source amid numerous land and port fires. Right: its final one-day detection on 21 July. NASA FIRMS data. Selection and analysis: Vladyslav Balinskyi.

FIRMS does not prove uninterrupted burning minute by minute, but it records repeated thermal activity at the same location from 6 to 21 July. Within the marine sector examined, this is the only prolonged source of its kind.

The same object was located in Sentinel-2 optical imagery. The 8 and 11 July frames show a vessel and a smoke plume at this point. In the 21 July image the vessel remains in place but is no longer burning or emitting smoke. The final FIRMS detection and the 21 July optical frame are not contradictory: the satellites passed over the area at different times, so FIRMS may have recorded the final phase of the fire several hours before the optical image.

8 July · Sentinel-2

Vessel with a smoke plume in the western Sea of Azov near the Kerch Strait on 8 July 2026

11 July · Sentinel-2

The same vessel with a smoke plume near the Kerch Strait on 11 July 2026

21 July · Sentinel-2

Vessel near the Kerch Strait on 21 July 2026 after the fire ended, with no smoke plume
The Sentinel-2 optical series shows the same vessel in the western Sea of Azov: a smoke plume on 8 and 11 July, and no smoke on 21 July. Copernicus Sentinel data. Analysis: Vladyslav Balinskyi, Green Leaf / NECU.

Confirmed pollution: Temryuk Bay, Kamennyi Cape and Primorsko-Akhtarsk

Radar scenes reveal another part of the picture — not fire, but oil films on the sea surface. In Temryuk Bay they form a separate time series. The pollution itself and its movement are confirmed, but without additional data each slick cannot be attributed to the vessel in the preceding episode.

In Sentinel-1 imagery, the configuration of the slicks changes between 8, 12, 14 and 20 July, while the main plumes shift eastward. In individual frames their measured lengths are approximately 13.07 and 5.37 kilometres.

8 July · Sentinel-1

Confirmed surface oil pollution in Temryuk Bay in a Sentinel-1 image from 8 July 2026

12 July · 13.07 km

Oil slick about 13.07 kilometres long in Temryuk Bay on 12 July 2026

14 July · 5.37 km

Oil slick about 5.37 kilometres long near the eastern part of Temryuk Bay on 14 July 2026

20 July · Sentinel-1

Local surface oil pollution in the eastern part of the observation area on 20 July 2026
Sentinel-1 radar imagery from 8, 12, 14 and 20 July shows changing configurations and the eastward displacement of confirmed surface oil pollution in Temryuk Bay and adjacent sectors. Copernicus Sentinel data. Analysis and measurements: Vladyslav Balinskyi.

Another confirmed episode appears in the 11 July optical frames near Kamennyi Cape. The overview and enlarged image show an elongated area of surface pollution. These frames are important as an independent record, but they should not be tied to a specific vessel or automatically folded into the history of the first source near the Kerch Strait.

Kamennyi Cape · overview

Elongated surface oil pollution near Kamennyi Cape on 11 July 2026, Sentinel-2 optical overview

Kamennyi Cape · enlarged view

Enlarged optical image of elongated surface oil pollution near Kamennyi Cape on 11 July 2026
Confirmed elongated surface oil pollution near Kamennyi Cape on 11 July 2026: overview and enlarged view. Copernicus Sentinel-2 data. Analysis: Vladyslav Balinskyi.

A separate vessel-related episode unfolded much farther east, off Primorsko-Akhtarsk. A Sentinel-2 optical image from 11 July shows a vessel with a substantial smoke plume. This is a different object, unrelated to the prolonged source near the Kerch Strait.

11 July · overview

Separate vessel with a smoke plume on the roadstead off Primorsko-Akhtarsk on 11 July 2026, Sentinel-2 overview

11 July · enlarged view

Enlarged optical image of a vessel with a smoke plume off Primorsko-Akhtarsk on 11 July 2026
The second vessel examined in this article: a smoke plume on the roadstead off Primorsko-Akhtarsk on 11 July 2026. Copernicus Sentinel-2 data. Analysis: Vladyslav Balinskyi.

By 12 July the smoke plume had disappeared, but the environmental episode was not over. A close Sentinel-1 radar frame already shows confirmed surface oil pollution beside the vessel.

Vessel and confirmed surface oil pollution off Primorsko-Akhtarsk in a close Sentinel-1 image from 12 July 2026
Close Sentinel-1 radar image from 12 July: the vessel off Primorsko-Akhtarsk and surface oil pollution extending from it. Copernicus Sentinel data. Analysis: Vladyslav Balinskyi.

The release continues in subsequent scenes. On 14 July one slick measured about 6.64 kilometres. In the final available frame, dated 26 July, a plume about 5.94 kilometres long remained beside the same vessel. Within the analysed series, the pollution therefore persisted from at least 11 to 26 July.

14 July · 6.64 km

Oil slick about 6.64 kilometres long extending from the vessel off Primorsko-Akhtarsk on 14 July 2026

26 July · 5.94 km

Oil slick about 5.94 kilometres long extending from the vessel off Primorsko-Akhtarsk on 26 July 2026
The vessel off Primorsko-Akhtarsk continued to release petroleum products: a slick of about 6.64 km on 14 July and about 5.94 km on 26 July. Copernicus Sentinel data. Analysis and measurements: Vladyslav Balinskyi.

What the ratio of fires and spills reveals about the nature of the operation

When the episodes are viewed at regional scale, the chronology forms a coherent system: a prolonged source near the Kerch Strait, a second vessel off Primorsko-Akhtarsk, and separate pollution events in Temryuk Bay and near Kamennyi Cape. Port and land fires remain a prominent backdrop to the operation, but the maritime component has a different structure.

Both vessels appear to be roughly one hundred metres long. This is consistent with the class of river–sea tankers and product carriers used in the Sea of Azov basin. Reports on the operation named vessels in the same size range, including Sanar-1, Venera-3, Penelope, Chelsea-6 and others. Such ships can therefore be treated as a pool of possible candidates, but the resolution of open imagery does not allow a specific vessel to be identified without AIS, port records or higher-resolution images.

According to the Unmanned Systems Forces, 129 vessels were hit in the Sea of Azov. Against that figure, one prolonged marine source, a second brief smoke event and several local spills are not a minor detail but the central result of the comparison. The mass rupture of cargo tanks on dozens of tankers would have left a fundamentally different signature in the satellite data.

What is visible is consistent with the declared tactic of Ukraine’s Unmanned Systems Forces: depriving vessels of navigation, control and propulsion without turning every strike into a sinking tanker. A satellite cannot see the precise impact point and cannot prove the method used against every vessel. It records the outcome: transport units leave the logistics chain, while the environmental harm, though real, does not grow into a cascading oil catastrophe.

The satellite data do not make this operation “environmentally clean”. They show something different: the harm was localised, while the strike on russian maritime logistics was regional.

The logistical effect of the operation is clearer than an environmental catastrophe. Vessels left roadsteads, reduced their visible activity and concentrated closer to ports and coastal protection. It was this system that carried fuel and military cargo through the Sea of Azov and occupied Crimea.

Two contrasts: Golden Leo and the Volgoneft tankers

The difference between striking military logistics and terror against civilian shipping was expressed most starkly in the Black Sea that same July.

On 19 July, russia attacked the civilian grain carrier Golden Leo with three Kh-59/Kh-69 cruise missiles. One struck the starboard superstructure and a fire broke out aboard the ship. Nine crew members and a Ukrainian pilot were killed; eight people were rescued. The search-and-rescue operation continued throughout the night under the constant threat of further russian strikes. The Ukrainian Navy described the attack as an act of terror against peaceful shipping. A week later, Golden Leo sank. There is no room here for neutral euphemisms: three missiles were launched at an unarmed ship loaded with corn, and ten human lives were taken.

Bulk carrier Golden Leo with a smoke plume after a russian missile strike in the Black Sea on 19 July 2026
Bulk carrier Golden Leo after a russian missile strike in the Black Sea on 19 July 2026. A prolonged smoke plume is visible on the horizon. Photo: Vladyslav Balinskyi.

The history of the Volgoneft tankers provides another contrast. This is no longer a story of local slicks, but of the systemic danger posed by russia’s ageing oil-tanker fleet.

russia’s system for transporting petroleum products through the Sea of Azov and the Kerch Strait was dangerous long before the present war. On 11 November 2007, the tanker Volgoneft-139 broke apart in a storm. More than 1,300 tonnes of heavy fuel oil entered the sea, pollution affected the coast and adjacent waters, and dead and affected birds were counted in the thousands.

In December 2024, the scenario was repeated with Volgoneft-212 and Volgoneft-239. Thousands of tonnes of heavy fuel oil entered the sea, struck the Anapa area and began spreading along the coast. Field and satellite research traced the pollution for at least 600 kilometres to Odesa Region.

These were not random accidents involving isolated ships. Engineer Gennadiy Yegorov warned for years about systemic risks in ageing Volgoneft tankers: corrosion, metal fatigue, inadequate structural margins and dangerous hull conversions. His analysis covered 169 accidents and disasters.

russia’s shadow and auxiliary fleet is therefore dangerous not only as military logistics. The sheer number of ageing tankers, barges and product carriers in a shallow, semi-enclosed sea creates a disaster risk that could exceed the local July releases by hundreds of times.

From satellite observation to evidence

All July episodes are to be added to the Black Sea Environmental Evidence Platform. Each event is assigned a date, coordinates, original imagery, the observation method, an interpretation and clearly stated limits of confidence.

This is especially important for the present investigation. The first vessel-related episode, the pollution in Temryuk Bay, the separate optical episode near Kamennyi Cape and the vessel off Primorsko-Akhtarsk must exist on the map as distinct evidence objects rather than as a single blended narrative.

The Platform does not claim to be a complete register of every pollution event. Conservative selection reduces the risk of false positives, but it also means that some real slicks may have remained outside observation. Every included episode can nevertheless be checked against the original frames and revisited when new AIS records or higher-resolution imagery become available.

Vladyslav Balinskyi certificate for a presentation on tracing oil slicks using Sentinel-1 and Sentinel-2 data
Certificate of Vladyslav Balinskyi’s participation in the 25th International Science Conference “Ecology. Human. Society”, where he presented the integrated methodology for tracing oil slicks using Sentinel-1 and Sentinel-2 data. Kyiv, 12 June 2025.

Satellite analysis of Operation Molochka answers not how many vessels were hit, but what happened to the sea afterwards. The answer cannot be reduced to the word “safe”: one vessel burned for an extended period, another remained a source of petroleum products until at least 26 July, and individual slicks stretched for many kilometres.

At the same time, against the scale of 129 reported strikes, the satellite picture does not resemble the mass breaching of cargo tanks or a series of tanker sinkings. It points to a major logistical effect and a localised environmental footprint. This does not excuse any spill; it records the difference between harm that was constrained and a catastrophe that could have engulfed both marine basins.

That difference is especially stark beside russian practice: the ageing and accident-prone Volgoneft fleet, strikes on Ukrainian ports, and three cruise missiles fired at Golden Leo. In every case the sea becomes a hostage to war. The task of open satellite monitoring is not to strip that emotion from the text, but to support it with evidence that can be checked.

Sources and related material

  1. Suspilne Crimea: Robert Brovdi’s statement on 201 vessels hit.
  2. Reuters Graphics: changes in shipping in the Sea of Azov and the Kerch Strait.
  3. UNN: declared tactic of disabling vessels without breaching cargo tanks.
  4. Ukrainska Pravda: vessels named as hit at the start of the operation.
  5. Reuters: russian strike on the Golden Leo bulk carrier and the deaths of ten people.
  6. Reuters: Golden Leo sank one week after the strike.
  7. The Maritime Executive: the Golden Leo rescue operation under threat of further strikes
  8. UNEP: assessment of the 2007 Volgoneft-139 accident in the Kerch Strait.
  9. Green Leaf: engineering warnings about Volgoneft tankers.
  10. Green Leaf: heavy fuel oil spill and consequences for the Black Sea ecosystem.
  11. Field research in Tuzly Lagoons National Nature Park: heavy fuel oil, war debris and cetacean deaths.
  12. Green Leaf: 900 km² of the Black Sea affected after a russian strike on vegetable-oil tanks.
  13. KPI: Integrated methodology for tracing oil slicks using Sentinel-1 and Sentinel-2 data.
  14. DOI for the scientific paper on the integrated methodology.
  15. Environmental Evidence Platform: interactive map of pollution and damage in the Black Sea.
  16. Full scientific and methodological description of the Environmental Evidence Platform.

Monitoring and preparation of evidentiary material are carried out through cooperation between the Green Leaf NGO, the National Ecological Centre of Ukraine and Tuzly Lagoons National Nature Park, with support from Deutsche Bundesstiftung Umwelt (DBU). The scientific content, interpretations and conclusions are the responsibility of the authors and participating organisations and do not necessarily reflect the position of DBU.

ByГерасимова Тетяна

Scientific Research into War Impacts on the Black Sea Coast in Tuzly Lagoons National Nature Park

Language version: Read this article in Ukrainian.

The international SUNDANSE project team is studying war impacts on the Black Sea coast in Tuzly Lagoons National Nature Park.

The expedition combined ecological monitoring with documentation of the effects of Russia’s military aggression on marine ecosystems.

Three specialists took part in the field research:

  • Vladyslav Balinsky — head of the Odesa branch of the National Ecological Centre of Ukraine and a research scientist at Tuzly Lagoons National Nature Park;
  • Ruslan Havryliuk — head of the National Ecological Centre of Ukraine and deputy director of the Institute of Geological Sciences of the National Academy of Sciences of Ukraine;
  • Ivan Rusev — head of the Research Department of Tuzly Lagoons National Nature Park.
Aerial view of the sandy barrier in Tuzly Lagoons National Nature Park between the lagoons and the Black Sea
The sandy barrier separating the Tuzly Lagoons system from the Black Sea. Photo: Vladyslav Balinsky

War impacts on the Black Sea coast

The sandy barrier separates the Tuzly Lagoons system from the Black Sea. It is the largest remaining natural section of Ukraine’s marine coast. Today, the area is increasingly affected by the war.

During the expedition, researchers found fragments of Russian aerial vehicles. They also recorded new deaths of Black Sea cetaceans and discovered heavy fuel oil on the shore. The pollutant continues to wash ashore after the December 2024 tanker accident near the Kerch Strait.

During the survey, the team documented:

  • debris from Russian aerial vehicles on the sandy barrier;
  • fresh heavy fuel oil clumps and older fragments partly covered by sand;
  • new deaths of Black Sea cetaceans.
Fragment of a Russian aerial vehicle found on the coast of Tuzly Lagoons National Nature Park
A fragment of an aerial vehicle found during the coastal survey in Tuzly Lagoons National Nature Park. Photo: Vladyslav Balinsky
Missile or aerial vehicle debris on the sandy Black Sea coast in Tuzly Lagoons National Nature Park
Another fragment found on the sandy barrier during field monitoring. Photo: Ruslan Havryliuk

Heavy fuel oil pollution persists after the tanker accident

One of the expedition’s main tasks was to search for new signs of heavy fuel oil pollution. Ruslan Havryliuk conducts this research within the international OIL-TRACE Black Sea project.

Its full title is Remote and Field Monitoring of Oil Pollution Dynamics in the Kerch Strait and the Tuzly Lagoons Region. The project is implemented with support from the German Federal Environmental Foundation (Deutsche Bundesstiftung Umwelt, DBU).

The field survey showed that the sea is still bringing new heavy fuel oil fragments ashore more than a year and a half after the accident.

Researchers found fresh clumps lying directly on the sand. Older fragments were already partly covered by sand deposits. This indicates that the pollutant continues to move with marine currents and periodically returns to the coast.

Ruslan Havryliuk holding a heavy fuel oil fragment found on the coast of Tuzly Lagoons National Nature Park
Heavy fuel oil fragment washed onto the sandy Black Sea coast

Heavy fuel oil fragments washed onto the coast of Tuzly Lagoons National Nature Park after the Russian tanker accident. Photo: Vladyslav Balinsky

How heavy fuel oil moves through the marine environment

According to Ruslan Havryliuk, satellite monitoring and field verification made it possible to trace the movement of the pollution. After the accident, heavy fuel oil migrated at least 600 kilometres along Ukraine’s Black Sea coast.

Much of the pollutant is not on the water surface. It can remain in the water column and bottom sediments. During strong storms, it may re-enter the water and contaminate the marine environment again.

The consequences are therefore not short-lived. They may persist for many years.

The spread of pollution into valuable protected areas of the north-western Black Sea is a particular concern. These areas include Tuzly Lagoons National Nature Park, adjacent protected waters and the Danube Biosphere Reserve.

Heavy fuel oil contaminates sediments and harms coastal ecosystems. It disrupts beach microbial communities and creates additional risks for birds and other marine wildlife.

Field research also verifies satellite observations directly on the ground. Combining the two methods helps researchers trace the pollution and build a scientific evidence base for documenting environmental damage caused by Russia’s aggression.

The number of dead Black Sea cetaceans continues to rise

The expedition also continued monitoring marine mammal deaths. The new findings indicate that the situation is deteriorating further.

According to Ivan Rusev, head of the Park’s Research Department, 12 more dead Black Sea harbour porpoises (Phocoena phocoena relicta) were found in the park between 3 and 8 July.

Dead bottlenose dolphin on the coast of Tuzly Lagoons National Nature Park
A dead bottlenose dolphin on the coast of Tuzly Lagoons National Nature Park. Photo: Vladyslav Balinsky

From late May to early July 2026, 74 dead Black Sea cetaceans were officially recorded in the park.

The Black Sea harbour porpoise is listed as Endangered (EN) on the IUCN Red List.

Researchers stress that official figures show only a small part of the real losses. They estimate that about 95% of dead cetaceans never reach the shore.

Bodies that wash ashore may be carried back to sea by waves. Jackals can also drag them into dense coastal vegetation before scientists or border guards document the findings.

Expert estimates cited in the field report suggest that tens of thousands of Black Sea cetaceans may have died during the first half of 2026. Total losses since the start of Russia’s full-scale invasion may exceed 100,000 animals.

Field data for international research projects

The survey was coordinated with the international SUNDANSE project. One of its tasks is to study the long-term environmental consequences of the destruction of the Kakhovka Hydroelectric Power Plant for the Black Sea.

The project systematises data on sediments released from the former Kakhovka Reservoir. Researchers study their composition, movement and effects on marine ecosystems.

They also analyse coastal pollution, changes in benthic ecosystems and the accumulation of hazardous substances in the marine environment.

Field surveys help assess war impacts on the Black Sea coast in a comprehensive way. Records of heavy fuel oil pollution, cetacean deaths and other wartime damage complement satellite monitoring. Together, these data support an evidence base on the environmental consequences of Russia’s aggression against Ukraine.

Data from the expedition are used in both SUNDANSE and OIL-TRACE Black Sea. This connects sediment transport research with documentation of long-term oil pollution and its effects on marine ecosystems.

Author: Tetiana Herasymova

An earlier version of this material was also published by the National Ecological Centre of Ukraine.

Deutsche Bundesstiftung Umwelt, German Federal Environmental Foundation

The monitoring was carried out with support from the Deutsche Bundesstiftung Umwelt (DBU, German Federal Environmental Foundation) under its programme supporting Ukrainian researchers and environmental professionals. The publication’s content, interpretation of data and conclusions are the responsibility of the authors and do not necessarily reflect the position of DBU.

ByVladislav Balinsky

Environmental Evidence Platform: Interactive Map of Pollution and Damage to the Black Sea

The interactive Black Sea pollution map combines satellite data, field observations, laboratory material and verified sources. It supports the documentation of environmental damage caused by russia’s aggression against Ukraine.

How to use the map. Open the layer catalogue, select an event or evidence type, and click a point, line or polygon. The object card provides the date, coordinates, observation method, photographs, sources and scientific cautions. Open the map full screen.

This platform was not created for neutral observation of the war. The russian federation is the aggressor state, and its full-scale invasion has caused extensive and long-term damage to Ukraine’s environment, including the marine and coastal ecosystems of the Black Sea.

The United Nations General Assembly formally defined russia’s actions as aggression against Ukraine. The UN Environment Programme also documents the war’s broad environmental consequences and their regional implications for the Black Sea.

Official Ukrainian assessments already measure damage to the Black Sea and Sea of Azov in the hundreds of billions of hryvnias. The real loss, however, is not limited to clean-up costs or damaged property. It includes habitat degradation, animal mortality and displacement, loss of ecosystem functions, persistent contamination, broken scientific time series and reduced capacity for recovery.

When an incident exists only as a news item, social-media post, photograph or satellite image, it can remain in the information space without becoming verifiable evidence. Investigation requires a date, coordinates, the original file, a named author or source, the acquisition method, links to related material and an honest statement of uncertainty.

This is why NGO Green Leaf, scientists from Tuzly Lagoons National Nature Park and project lead Ruslan Havryliuk developed a tool that brings these materials together in a single geospatial environment.

Each point, line or polygon opens not merely a symbol but an evidence card containing the date, coordinates, observation method, photographs, satellite material, sources, scientific interpretation and remaining uncertainty.

The platform is designed to preserve, verify and organise material that may be important for investigations of environmental crimes, possible war crimes, proceedings concerning ecocide under Ukrainian law, and future claims for compensation and reparations. The map does not issue legal judgments: legal qualification belongs to investigators, prosecutors, experts and courts. Our task is to prevent evidence from disappearing, preserve its provenance and make the verification method transparent.

The platform is not a complete register of every pollution event in the Black Sea. It includes incidents for which the team has sufficiently reliable satellite, field, laboratory or documentary material. The absence of an event from the map must not be interpreted as evidence that no pollution occurred.

Why the marine environment requires a dedicated evidence system

During war, the sea is one of the least accessible environments for regular scientific monitoring. The occupation of Crimea, hostilities, mine danger, attacks on ports and vessels, navigation restrictions and risks to research teams make the conventional model of systematic ship-based observation impossible across substantial parts of the marine area. Actual access changes with the security situation and cannot honestly be reduced to one stable percentage.

Under these conditions, open satellite data, field verification along accessible coastlines, laboratory analysis and secure preservation of media become core rather than supplementary tools. They make it possible to observe processes where a research vessel cannot safely operate, while also showing where remote interpretation requires field or laboratory confirmation.

Evidence for damage assessment and compensation

Documentation is directly connected to future compensation. Category B3.1 of the Register of Damage Caused by the Aggression of the russian federation Against Ukraine expressly covers environmental damage, monitoring and assessment costs, restoration measures and loss of intrinsic ecological value.

Evidence collected and organised today can therefore form an initial layer for future state claims for compensation and reparations. Formal submission will still require separate authentication and action by the competent authorities.

International scientific cooperation

The platform is also an appeal to the international scientific community. Ukrainian researchers need more than statements of solidarity: they need access to satellite archives and computing capacity, laboratory facilities, equipment, secure repositories, international expertise and support for safe field missions. Without such support, a substantial share of marine damage will remain undocumented.

From initial cases to a scalable system

The current edition grew out of the documentation of three events with different physical and ecological characteristics: the Volgoneft-212 and Volgoneft-239 tanker disaster and heavy-fuel-oil pollution; the vegetable-oil spill associated with the Port of Pivdennyi (VO-1); and the spill associated with the Port of Chornomorsk (VO-2).

These cases do not define the final boundaries of the project. They form the first fully developed test of a common approach that can be applied to new accidents, damaged vessels, consequences of Russian strikes on port and maritime infrastructure, affected habitats, animal mortality and other forms of environmental harm.

Every event uses the same internal logic:

  • source and primary release;
  • development and transport;
  • field evidence and sampling;
  • biological and habitat impacts;
  • analytical reconstruction.

This structure reveals a complete causal chain rather than an isolated dark patch on a satellite image. It connects a probable source with immediate and delayed effects, including secondary accumulation of contaminants in bottom sediments and their later remobilisation into the water column and marine circulation.

This is especially important in the semi-enclosed Black Sea: the disappearance of a surface slick does not mean that the impact has ended. Basin-scale cyclonic circulation generally proceeds counterclockwise and can transport tracers between eastern and northwestern sectors, including towards the Odesa coast and the Danube Delta.

The actual pathway of each event nevertheless depends on wind, waves, mesoscale eddies, stratification and local currents. It must therefore be assessed event by event using satellite, field and modelling evidence: Black Sea circulation, variable Kerch Strait exchange, and post-depositional remobilisation.

The map is also a georeferenced media repository. Users can move from a mapped object to a photograph, a satellite crop, an analytical document or a public source. This is useful for scientists, protected-area staff, journalists, civil-society organisations, investigators and experts who need to understand not only what is shown, but what evidence supports the description.

How an evidence object is built

The principal unit of the platform is not the layer or the symbol, but the evidence object. It may be a field-observation point, the boundary of a satellite anomaly, an affected habitat, a sampling site, the position of a vessel fragment or a reconstructed transport line. Each card contains complete English and Ukrainian sections so that the material can support both national and international communication.

How to read the map geometry:

  • Points mark observations, finds, sampling locations or probable sources.
  • Lines show documented movement or cautiously framed analytical reconstructions.
  • Polygons outline interpreted boundaries of satellite anomalies, contaminated areas or affected habitats.

The cards distinguish three levels. Direct observation is what is recorded in an image, in the field or in a document. Interpretation is the scientific explanation of that observation. Analytical reconstruction is the reconstruction of a probable source, pathway or relationship between separate observations. Keeping these levels separate reduces the risk that a working hypothesis will be read as a directly established fact.

Data provenance is preserved in the same way: photographer, institution providing field material, person responsible for samples, laboratory or media partner, and source of satellite data. A numerical laboratory value is not assigned to an individual point unless the sample identifier, location and date can be matched explicitly.

Satellite methodology and field verification

Radar and optical satellite data

The remote-sensing workflow integrates radar data from Sentinel-1 and optical imagery from Sentinel-2. Radar makes it possible to examine the sea surface independently of daylight and with substantial all-weather capability.

Surface films can damp short waves and produce dark anomalies in SAR imagery. Similar signatures may also be caused by low wind, natural surfactants, atmospheric processes or current boundaries. A dark area is therefore an analytical lead rather than automatic proof of pollution.

Sentinel-2 helps verify boundaries, colour and structure, and can reveal dense accumulations, emulsions and individual surface objects. Time-series analysis is combined with meteorological conditions, slick morphology and independent evidence. Where an underwater leak is suspected, backward tracing relates persistent dark-core zones to the direction of transport, water depth and the estimated rise of particles from the source to the surface.

The approach is described in the published paper Integrated methodology for tracing oil slicks using Sentinel-1 and Sentinel-2 data: backward modelling, meteorological correction, and visualization analysis, presented in the proceedings of the “Ecology. Human. Society” conference; DOI: 10.20535/EHS2710-3315.2025.332100.

Field verification

Satellite interpretation does not replace fieldwork. In Tuzly Lagoons National Nature Park, field verification is conducted by the Park’s Research Department under the scientific supervision of Ivan Rusev. It includes GPS positioning, photography, descriptions of substrates and habitat condition, biological observations and sample collection. Ruslan Havryliuk coordinates sample records, integration of laboratory data and scientific interpretation of analytical results.

Three current cases — the first operational edition

Volgoneft. This module combines accident and wreck locations, dated satellite observations, probable residual leak sources, drift reconstructions and M-series field points documenting heavy-fuel-oil contamination. A central task is to show where direct evidence ends and where the hypothesis of long-range transport toward the Odesa coast begins.

VO-1. The vegetable-oil spill associated with the Port of Pivdennyi demonstrates the temporal development of an industrial surface film and the way its visibility changes between radar and optical imagery.

VO-2. The event associated with the Port of Chornomorsk provides the most complete chain, from the port source and satellite dynamics to field and biological verification. It includes FP-1, FP-2 and FP-3, documented by Ivan Rusev and the Park’s Research Department: impact on a protected sandy barrier, a psammophilic habitat and vegetable-oil film or emulsion in coastal waters.

Together, these modules show that the same architecture can be used for different pollutants and evidence types. Future events will be added as new modules within the existing system rather than through the creation of a separate map from the beginning.

Media repository, data provenance and limits of inference

Photographs, satellite crops and documents are not treated as decorative illustrations. They remain linked to a specific place and statement. Media are attached to an existing evidence object when they describe the same spatial situation. A separate media point is created only when the material has independent spatial meaning.

M-series heavy-fuel-oil field photographs and materials are attributed to Vladyslav Balinsky and Ivan Rusev according to the current register. FP-1, FP-2 and FP-3 materials were provided by Ivan Rusev and Tuzly Lagoons National Nature Park. Analytical data associated with the M-6/M-7 survey were obtained within the work of the International Charitable Organization Environment–People–Law and provided to the project by Olena Kravchenko.

The platform is designed to preserve material that may be important for investigations of environmental crimes, possible war crimes, proceedings concerning ecocide, and claims for compensation and reparations. Publication on the map does not replace procedural authentication, a proper chain of custody, laboratory traceability, independent expert validation or a decision by a competent authority.

Who develops and maintains the platform

Vladyslav Balinsky — remote-sensing methodology; Sentinel-1 and Sentinel-2 processing and interpretation; scientific mapping; field verification; evidence-system architecture; and publication preparation; Research Department, Tuzly Lagoons National Nature Park.

Ruslan Havryliuk — project leadership; scientific coordination; sample and laboratory-data coordination; integration of analytical results; and scientific review.

Ivan Rusev — scientific supervision of field verification; biological and ecosystem interpretation; validation and provision of field materials from Tuzly Lagoons National Nature Park.

NGO Green Leaf is the project’s publication and media platform. Related institutional and project materials are published by the National Ecological Centre of Ukraine, including the SUNDANSE project page.

The platform is developed and implemented with support from the German Federal Environmental Foundation — Deutsche Bundesstiftung Umwelt (DBU), project 30025/100. The authors and partner organisations gratefully acknowledge DBU grant support. Scientific content, interpretations and conclusions remain the responsibility of the authors and participating organisations.

This work also has a personal dimension. In January 2026, the National Ecological Centre of Ukraine reported systematic persecution, in-absentia criminal proceedings and direct threats against Vladyslav Balinskyy connected with his role in documenting war crimes and acts of ecocide.

This is another reason why an evidence base must not depend on the safety of one person or remain in a private archive. It should be distributed, open to verification and institutionally protected.

How to use the map and what comes next

Open the layer catalogue, select an event and click an object. Its evidence card provides photographs, sources, documents, the observation method and limitations. Satellite and field polygons are scientific interpretations of spatial evidence rather than perfectly exact physical boundaries of pollution.

Submit material. Photographs and reports of heavy fuel oil, petroleum, vegetable oil, dead or affected dolphins, birds and other biota can be sent to zeleniy.list1@gmail.com. Please include the original photographs, date, location or coordinates and a short description. Do not place yourself at risk in order to document an event.

The public map is a viewing and verification interface. It does not replace protected storage of original files, the internal evidence register or a procedural chain of custody.

  • For social media, press communication and general sharing, use the URL of this article.
  • For full-screen analysis, use the direct uMap link.
  • For scientific use, open the individual evidence card and review its sources and limitations.
  • The platform will be expanded as new verified data and event modules become available.

Read the full scientific and methodological description

Language version: Читати українською.


Suggested citation: Balinsky, V.; Havryliuk, R.; Rusev, I. Environmental Evidence Platform: Interactive Map of Pollution and Damage to the Black Sea. NGO Green Leaf, 2026. The map is a living resource; an access date should be included when citing it.

An adapted institutional version of this publication is also available from the National Ecological Centre of Ukraine: “How Ukraine Is Documenting Environmental Damage to the Black Sea” .

Deutsche Bundesstiftung Umwelt — German Federal Environmental Foundation

The monitoring was carried out with the support of Deutsche Bundesstiftung Umwelt (DBU, German Federal Environmental Foundation) under its programme supporting Ukrainian researchers and conservation professionals. The content of this publication, the interpretation of the data and the conclusions are the responsibility of the authors and do not necessarily reflect the position of DBU.

ByVladislav Balinsky

Elektrostal, July 2026: A Spatial-Dynamic Analysis of the Environmental Consequences of Strikes on Logistics and Fuel Infrastructure

Sentinel-2 imagery, atmospheric transport, combustion chemistry, public-health risks, and the limits of official air-quality monitoring

Vladislav Balinsky — chemist, biologist, and editor-in-chief of the online environmental outlet Zelenyi Lyst

Why This Analysis Matters

We are not examining this incident because the fire itself is inherently compelling.

During the night of 18 July 2026, drones struck two facilities in the Moscow region: the Wildberries logistics centre in Elektrostal and an oil depot in Noginsk. According to RT, 24 people were injured in Elektrostal; one of them later died in hospital.

When we examined Sentinel-2 imagery acquired on 19 July, we saw that the smoke did not disperse over empty countryside. It moved across a densely populated area and, in the near-source zone, remained close to the ground. This raises the obvious environmental-health questions: what was in that air, and what were local residents told?

Key finding. The satellite image matters here not as a photograph of a fire, but as a snapshot of the spatial structure of atmospheric transport of combustion products.

The official response came quickly. On 18 July, the same day as the strikes, RIA Novosti, citing the Moscow Region Ministry of Ecology and Natural Resources, reported that no exceedances of ambient-air quality standards had been identified in Elektrostal or the Bogorodsky district. Rossiyskaya Gazeta relayed the same wording, but added a detail that should not be overlooked: no exceedances had been recorded, yet a smell of burning was reported at several locations.

A smell of burning is not a metaphor. It is the human sensory detection of combustion products in air. In other words, substances were present at concentrations high enough to be smelled, while the instruments reportedly registered nothing of concern. How is that possible? The answer lies in what was actually measured.

RT, also citing the ministry, stated that 20 fixed monitoring stations sample between five and eight parameters. Kommersant added that a mobile laboratory operated by Mosoblekomonitoring was working at the site and could measure 32 parameters.

Now consider what was burning: approximately 250,000 square metres of marketplace goods, including PVC packaging, synthetic textiles, polyurethane, consumer electronics, and lithium-ion batteries. Such a fire may generate hydrogen cyanide, phosgene, hydrogen chloride, hydrogen fluoride, dioxins, furans, and polycyclic aromatic hydrocarbons.

Standard urban air-monitoring stations do not normally measure most of these compounds. They measure the pollutants for which they were designed: carbon monoxide, nitrogen and sulphur oxides, and particulate matter. Dioxins cannot be detected by rapid field methods at all; they require chromatographic mass-spectrometric analysis and laboratory processing that may take weeks.

One qualification is essential. The ministry did not specify which five to eight parameters were measured, so our assessment is based on the general operating practice of such stations. If cyanides, phosgene, and organochlorine compounds were in fact analysed, that can be demonstrated easily: publish the measurement protocols. The question could be settled within a day.

What “No Exceedances Were Recorded” Actually Means

The ministry’s statement concerns air — more precisely, the samples collected by instruments on 18 July. That information is useful. But a fire of this type raises four distinct questions, and the statement addresses only one of them.

Air while the fire is burning. Concentrations are highest during active combustion, and this is when monitoring matters most. Yet an instrument can report only what it is designed to detect. If cyanides, phosgene, and organochlorine compounds are not on the analytical list, they will not appear in the report — even if they are present. In this context, “no exceedances” means only “no exceedances among the substances that were tested.”

Air after the flames have been knocked down. Monitoring reportedly continued until the fires were fully contained, which is logical from a narrow air-quality perspective: once combustion stops, the emission source diminishes. But containment does not mean the event is over. Debris removal and water application continued for several days, while oxygen-deficient smouldering can generate substantial concentrations of incomplete-combustion products. People working or living nearby may therefore remain exposed after routine measurements have ceased.

People. This is no longer an air-sampling question. Phosgene may produce delayed effects: a person can inhale it during the fire, feel relatively well the next day, and develop pulmonary oedema 24 to 48 hours later. By that point, measuring the air may be meaningless — the air may be cleaner while the person is not. Medical observation for at least 72 hours is required in suspected exposure scenarios. No public reports indicated that such monitoring had been organised in Elektrostal or Noginsk.

Soil and what grows on it. Dioxins are not captured by rapid field methods. They deposit onto soil and water and can subsequently enter vegetables, milk, and fish. Detecting them requires laboratory analysis of environmental samples after the fire has been extinguished, followed by monitoring over months. No such programme was publicly reported.

Of the four questions, the official response therefore addresses only one — and even that only partially.

Debris That Falls by Itself

Now consider not the figures, but the language. In this case, words perform almost as much work as instruments.

The governor of the Moscow region stated that a fire broke out when one of the drones fell. Grammatically, the drone did not strike; it fell. The fire was not caused by an impact; it simply occurred. The sentence contains no acting subject, no strike, and not even a clearly identified object that was hit. There is only a naturalised sequence: something fell, and something caught fire.

This is not an isolated communications failure. It is a stable construction familiar from Russian official reporting in recent years: not “a strike on an oil depot,” but “falling UAV debris”; not “an impact,” but “a fire caused by falling debris.” In this linguistic world, the debris exists independently. It is no longer part of something that was flying towards and struck a target.

The air-quality statement is built on the same principle. Note the wording: not “the air is clean” or “there is no danger,” but “no exceedances of standards were recorded.” Formally, this is not a statement about the condition of the air. It is a statement about the act of recording. It is difficult to refute because it makes no direct claim about the environment; it says only that the instruments did not register an exceedance.

And in the same communication, several locations were reported to have a smell of burning.

This is where the language reveals its function. “Smell” is an everyday word: scorched food, a neighbour’s bonfire. It does not belong to the vocabulary of hazard. Yet a smell of burning is precisely the sensory detection of airborne pollutants by people in places where the instruments supposedly recorded nothing.

Three elements form a single communications structure. There is no actor who struck the target — only debris that fell. There is no pollution — only exceedances that were not recorded. There are no toxicants — only a smell of burning.

This formula can be named in different ways, but its function is clear: to reduce public alarm without making a directly falsifiable statement. Each individual phrase is defensible. The danger lies in their combination.

There is another important circumstance. This is not a remote province where information takes weeks to circulate. It is the Moscow region: densely populated, adjacent to the capital, equipped with an extensive monitoring network, and covered by dozens of newsrooms. There is no shortage of instruments, journalists, or opportunities to ask questions. The wording is therefore less plausibly explained by a lack of data than by a deliberate choice.

The speed of reassurance is also revealing. The calming conclusion was published on 18 July — the same day as the incident and before the fire had been contained.

A Comparison: Tuapse, Three Months Earlier

To understand how far this response departs from an established pattern, consider a case we analysed in the spring.

After strikes on the Tuapse oil terminal on 16 and 20 April 2026, Rospotrebnadzor recorded concentrations of benzene, xylene, and soot at two to three times the maximum permissible levels. The Krasnodar regional emergency headquarters advised residents to remain indoors unless necessary and to keep windows closed.

The same state apparatus, the same country, three months apart. In Elektrostal, where a far more heterogeneous and potentially more toxic mixture was burning than crude oil alone, the public message was that nothing had been detected.

There are two possible explanations. Either the air in Elektrostal was genuinely cleaner than in Tuapse, which is physically difficult to reconcile with the nature of the fuel load, or the difference lay in what was measured and what authorities chose to disclose.

It is important to stress that all the reporting cited above comes from RIA Novosti, Rossiyskaya Gazeta, RT, Kommersant, and official statements by the relevant Russian ministry. No Ukrainian source is required for this comparison. We have simply placed those reports alongside one another and compared them with what is visible in the satellite imagery.

We begin with that imagery.

1. What the Satellite Revealed

The Sentinel-2 image was acquired on 19 July, approximately 30 hours after the strike. It therefore does not show the peak burning phase, but a later stage characterised by residual combustion, smouldering, and intensive water application.

Two distinct source areas are clearly visible: a compact, dense plume near Elektrostal and a broader, more diffuse smoke veil over Noginsk, extending eastward along the M-7 motorway. Importantly, we identified this two-source structure in the image before cross-checking it against media reporting. The reports subsequently confirmed two affected facilities: the Wildberries logistics centre, covering approximately 250,000 square metres, and an oil-depot fire in Noginsk.

The light-grey colour of the plume is consistent with a late fire phase in which smouldering and heavy water application predominate. This does not imply that the incident was minor. At the time of acquisition, the source areas remained active; the main fire was reportedly contained only during the second half of 19 July.

For this analysis, the image is not merely a photograph of a fire. It is a snapshot of the spatial structure of atmospheric transport of combustion products.

Супутниковий знімок Sentinel-2 пожежі в Електросталі та Ногінську, 20 липня 2026 року

Figure 1. Sentinel-2 image acquired approximately 30 hours after the strike. Two smoke sources are visible: the logistics complex in Elektrostal and the oil depot in Noginsk.

2. More Than Oil Was Burning — and That Complicates the Forecast

The two fire sources involved fundamentally different combustion chemistry. This is not a secondary detail; it is the foundation of the risk assessment.

An oil-depot fire produces a comparatively predictable emissions profile: carbon and sulphur oxides, soot, polycyclic aromatic hydrocarbons, and volatile organic compounds. We examined this profile in detail in our earlier analysis of Russian oil refineries.

A 250,000-square-metre logistics complex is a different type of source. Its potential fuel load includes plastics, PVC packaging, synthetic textiles, polyurethane, cardboard, consumer electronics, and lithium-ion batteries. Where substantial quantities of PVC undergo thermal decomposition, chlorine-containing combustion products are expected, creating conditions under which dioxins and furans may form. Lithium-ion batteries may contribute hydrogen fluoride and metal oxides; synthetic materials may generate cyanide compounds.

In other words, this incident activates a specific rule in our model: chlorine-containing materials can sharply alter the hazard profile and require long-term environmental response, not merely fire suppression.

3. Four Different Risks, Not One

The practical implication of this chemical profile is that there is no single hazard. There are at least four, separated in time and requiring different response protocols.

The first minutes. Synthetic materials and polyurethane can release hydrogen cyanide during combustion. It inhibits cellular respiration and can act within minutes. Carbon monoxide, acrolein, hydrogen chloride from PVC, and hydrogen fluoride from batteries may add to the acute hazard. At this stage, the decisive factor is the speed of evacuation; medical intervention may come too late for those with severe exposure.

One to three days. This is the most deceptive interval. In cooler combustion zones, phosgene may form under appropriate conditions in the presence of chlorine-containing compounds. Toxic pulmonary oedema can then develop after a delay, when the exposed person is already at home and feels relatively well. Hospitalisation during the first night is therefore not a guarantee of safety; observation should continue for at least 72 hours.

Several days for those working at the site. Debris removal and prolonged water application entail repeated work in a smouldering zone, where concentrations of incomplete-combustion products may remain high. Ordinary filtering respirators are not sufficient against carbon monoxide, hydrogen cyanide, or phosgene. Positive-pressure self-contained breathing apparatus is required.

Years. Dioxins, furans, and metals released from electronics create a different risk horizon involving soil, food chains, and long-term medical surveillance. This is the fourth layer of response — and the one for which no public programme was reported.

4. Who Is Affected — and Who Will Not Appear in the Reports

We can now apply this temporal framework to what is known about the people involved.

Official reports referred to 24 injured people in Elektrostal and two in Noginsk. One of the injured later died in hospital, meaning that even the initial casualty figures changed.

These figures represent acute trauma: burns, blast fragments, and poisoning during the first hours. By definition, they do not capture three other groups.

People beneath the plume. When populated areas are exposed to combustion products, increases in presentations for hypertensive crises, arrhythmias, asthma attacks, and exacerbations of chronic obstructive pulmonary disease are statistically expected, especially among older people and those with chronic illness. This is not a claim about specific undocumented cases; it is a well-established pattern in smoke-affected populations. The absence of public data does not prove that no effect occurred. It may simply mean that no one counted it.

Emergency responders. This is probably the most heavily exposed group and one of the least discussed. Many effects may be delayed, which is precisely why responders require structured medical observation rather than ceremonial praise in a press release.

People whose clinical window had not yet closed. At the time of publication, approximately three days had passed since the night of 18 July — exactly the interval in which delayed pulmonary oedema may become apparent. People who initially felt well and did not seek help could therefore have been entering the most critical phase. This was not a future forecast; it was the risk window open at the time the article was published.

5. Where the Plume Went

The remaining question is geographical: how far were the combustion products transported?

In the near-source zone, the plume moved towards the north-east and then turned northward. Its geometry does not show an abrupt shift in direction or pronounced fragmentation, suggesting relatively stable air-mass transport during a substantial part of the fire.

Супутниковий знімок Sentinel-2 району Електросталі та Ногінська із просторово протяжним шлейфом продуктів горіння.

Figure 2. Sentinel-2, 19 July 2026. The visible smoke-plume axis extends northward from Elektrostal and Noginsk, passing east of Sergiyev Posad. Source: Sentinel-2, European Space Agency.

The optically dense portion of the plume can be followed with confidence for approximately 300 kilometres: through the Orekhovo-Zuyevo area, east of Sergiyev Posad, and towards the Rybinsk Reservoir. This trajectory crosses parts of the Moscow and Yaroslavl regions and may have affected the western edge of the Vladimir region.

The 300-kilometre estimate applies only to the part of the plume visible in the imagery. Fine particles and gaseous combustion products may have travelled farther; beyond a certain distance, they are simply no longer distinguishable in the optical image.

One further observation is important for understanding the transport mechanism. Near the source, the smoke remained low and close to the surface. Farther away, it became elevated and diffuse within the atmospheric boundary layer. This is a typical transition from near-source ground-level pollution to regional transport, and it helps explain why different zones require different response protocols.

During this particular meteorological window, the principal atmospheric burden remained over Russian territory. No transport towards Ukraine was observed. Under different meteorological conditions, the spatial pattern would have been different.

6. A Brief Note on the Legal Framework

Because this analysis concerns the consequences of a strike, the status of the targeted facility cannot be ignored.

A logistics hub of this scale may serve both civilian and military supply chains. Dual use is not necessarily a property of a building itself; it is a property of the logistical flows passing through it. Ukrainian sources have stated that such hubs were used to supply sanctioned components for drones and navigation equipment. Russian military bloggers also publicly asked where drones and fibre-optic cable would now be procured.

There is currently no direct open-source confirmation of the contents of this particular warehouse, and that limitation must be acknowledged. At the same time, Articles 57 and 58 of Additional Protocol I to the Geneva Conventions require parties controlling territory to take precautions and, to the extent feasible, separate military objectives from civilian populations and civilian objects. Where military logistics are routed through civilian infrastructure, risks to civilians arise in large part from that organisational choice.

7. Conclusions

This case is not maritime. It involves a different mode of transport, different chemical profiles, and a different legal framework. Yet the model operates in the same way.

Atmospheric transport determined the spatial structure of risk. Combustion chemistry determined its temporal dynamics. The configuration of the logistics hub informed the legal character of the object.

Our spatial-dynamic model makes it possible to:

identify primary impact zones;

separate risks by time scale — minutes, days, weeks, and years;

determine who requires immediate evacuation, who needs 72-hour medical observation, and where soil monitoring may be the appropriate response;

assess the legal character of an object through the function of logistical flows rather than the nominal status of a building.

This brings us back to the starting point.

Strikes on oil depots and logistics centres have more than an economic dimension. They also have environmental and public-health consequences for people living nearby. That principle applies regardless of the side involved or the territory affected.

Residents of Noginsk and Elektrostal were not told what symptoms might emerge a day later. They were not told who should seek medical attention. Responders were not publicly warned that a filtering respirator is not adequate protection in a smouldering zone.

At this point, the conclusion must be stated plainly. The problem was not an absence of capacity. The Moscow region operates 20 fixed stations and a mobile laboratory covering 32 parameters. Three months earlier in Tuapse, the same state system publicly reported concentrations two to three times above permissible limits and advised residents to keep their windows closed. The instruments exist. The specialists exist. The experience exists.

The selection of analytical parameters therefore cannot be dismissed simply as ignorance. Compiling a panel that excludes the compounds most relevant to this particular fire requires an understanding of which compounds are relevant. It is competence applied in the opposite direction.

This leads to a broader conclusion.

What is concealed is usually something whose consequences are understood. Silence of this quality is rarely the product of mere negligence; it is the product of work. That implies that actors within the system understand both the scale of what occurred and the circumstances in which it began — not with debris falling in isolation, but with the war launched and continued by the Russian state, for whose environmental consequences it will bear responsibility alongside the rest.

That responsibility does not disappear because it was not documented domestically.

One final point concerns Ukraine.

Ukraine remains under continual attack. Part of its territory is occupied. Its own ecosystems are being destroyed: the destruction of the Kakhovka Dam, pollution of the Black Sea, and millions of hectares of mined, burned, and degraded land. Yet Ukrainian civil-society organisations continue to document the environmental consequences of the war not only in Ukraine, but also within the territory of the aggressor state.

This is not because Ukraine lacks other priorities. It is because the environmental consequences of this war will eventually have to be assessed in full — on both sides of the front line, using a consistent methodology and without exceptions. We have an interest in making that accounting accurate. Those who remain silent about fires on their own territory do not share that interest in precision — and that, too, is evidence.

Postscript

This article continues Zelenyi Lyst’s series on the environmental consequences of strikes on infrastructure. Earlier case studies examined Tuapse in April 2026 and the Kerch Strait in June 2026. The model remains unchanged from case to case; only the specific transport parameters, chemical profiles, and legal frameworks vary. In our view, that consistency is what distinguishes a working analytical model from a collection of unrelated incident descriptions.

Sources

Event and air-monitoring data: RIA Novosti, Rossiyskaya Gazeta, RT, and Kommersant, 18 July 2026, citing the Moscow Region Ministry of Ecology and Natural Resources. Satellite data: Sentinel-2, European Space Agency, 19 July 2026.